Unlock the power of dashboard analytics with Surplus Systems. This article provides a concise overview of accessing, understanding, and utilizing analytics from your dashboard to drive business growth and make data-driven decisions. Ideal for users looking to elevate their analytical capabilities.
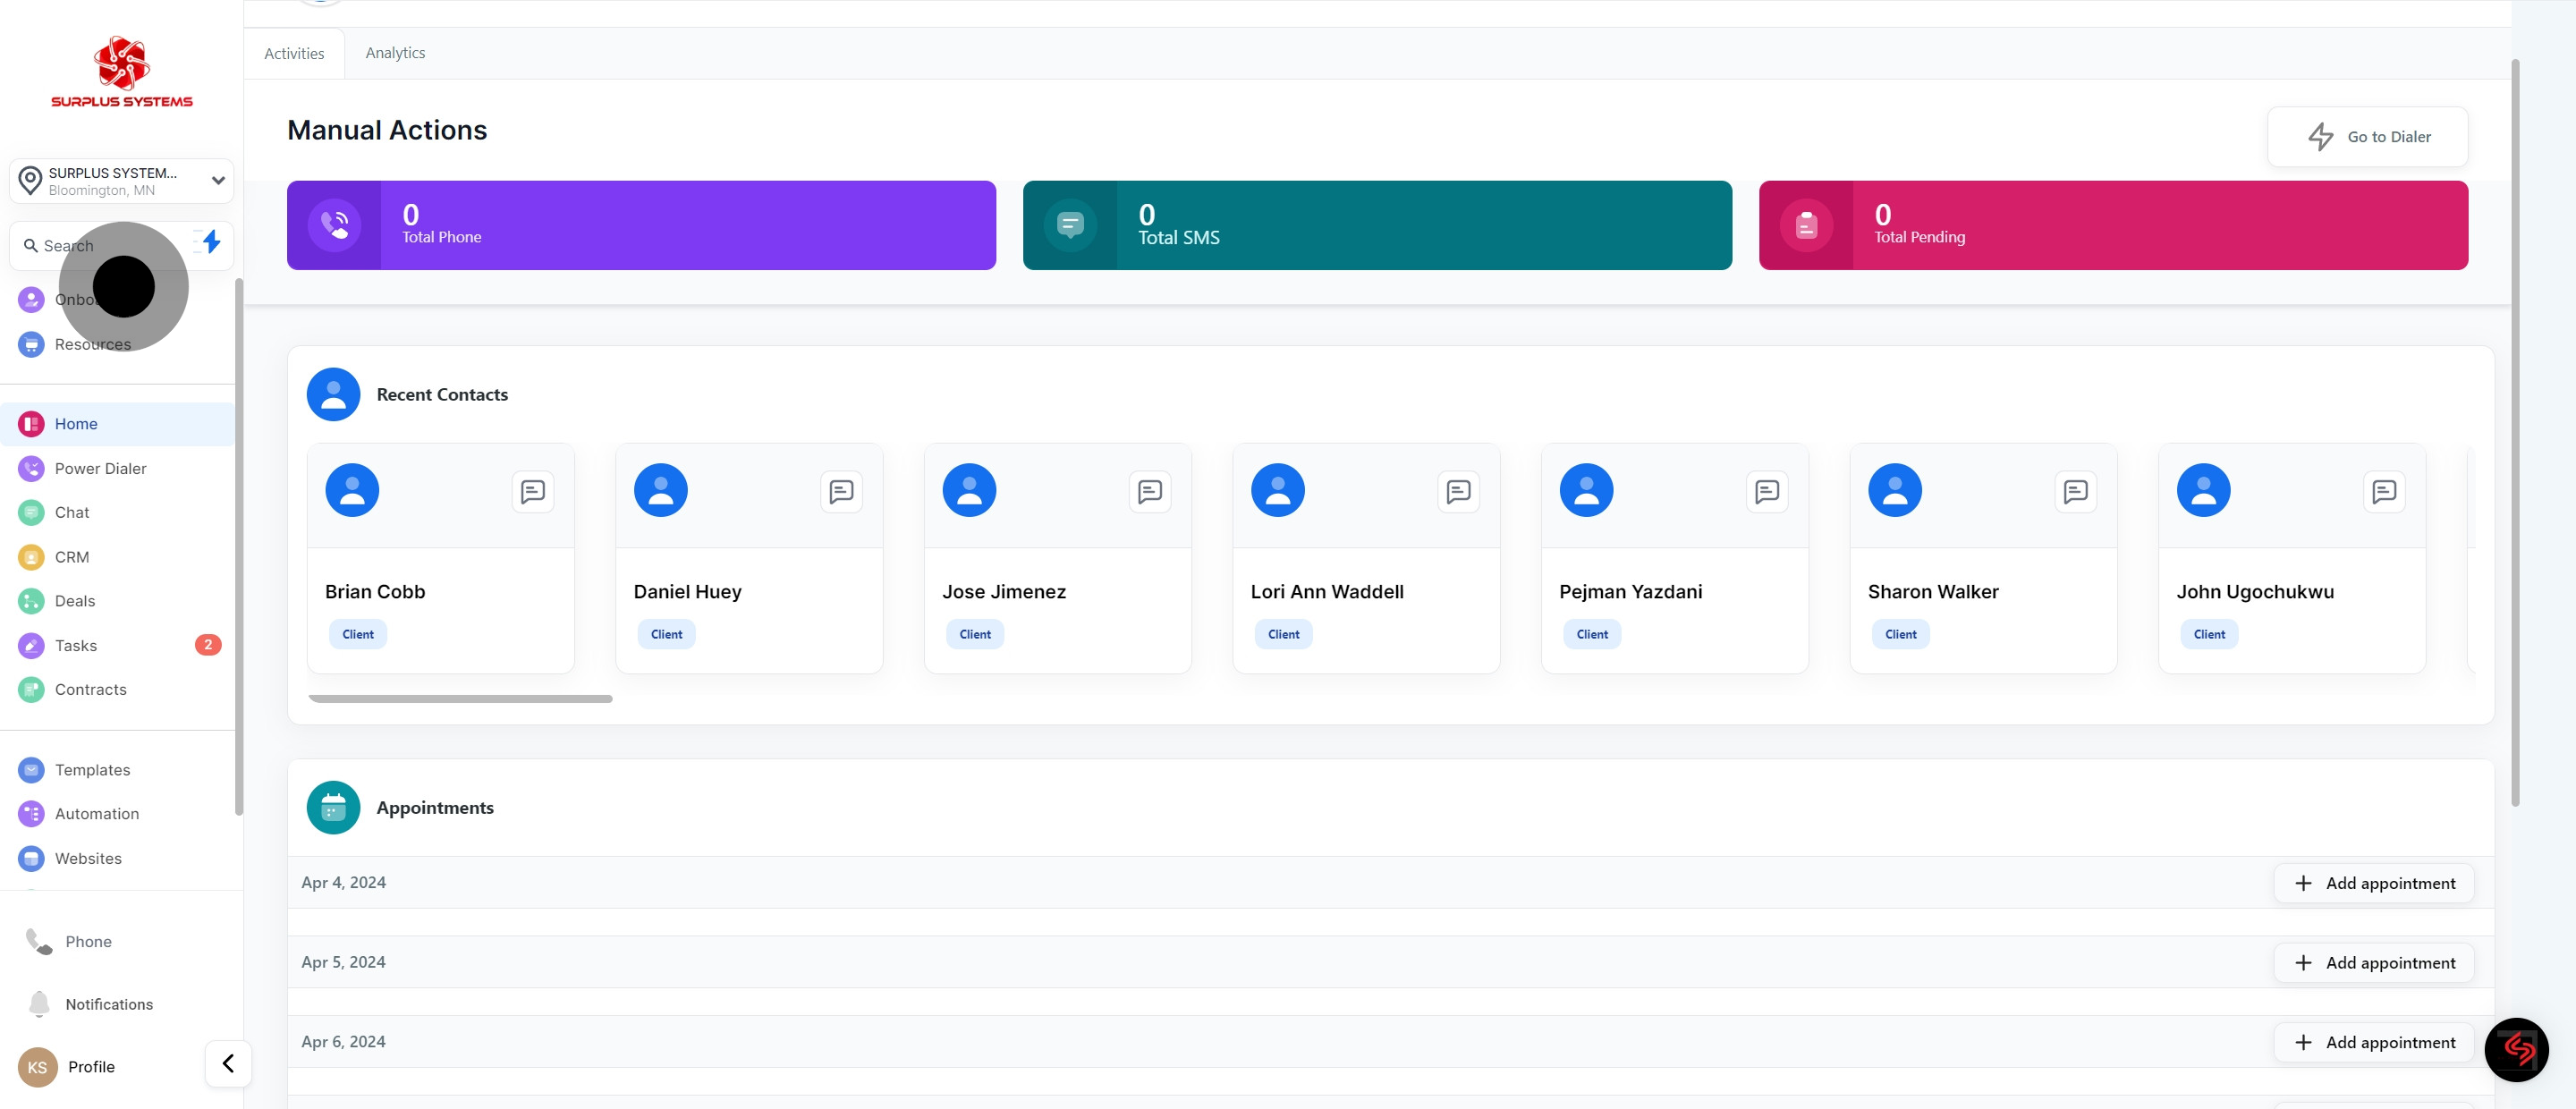
1. To start off, click Home
2. Then, click on "analytics".
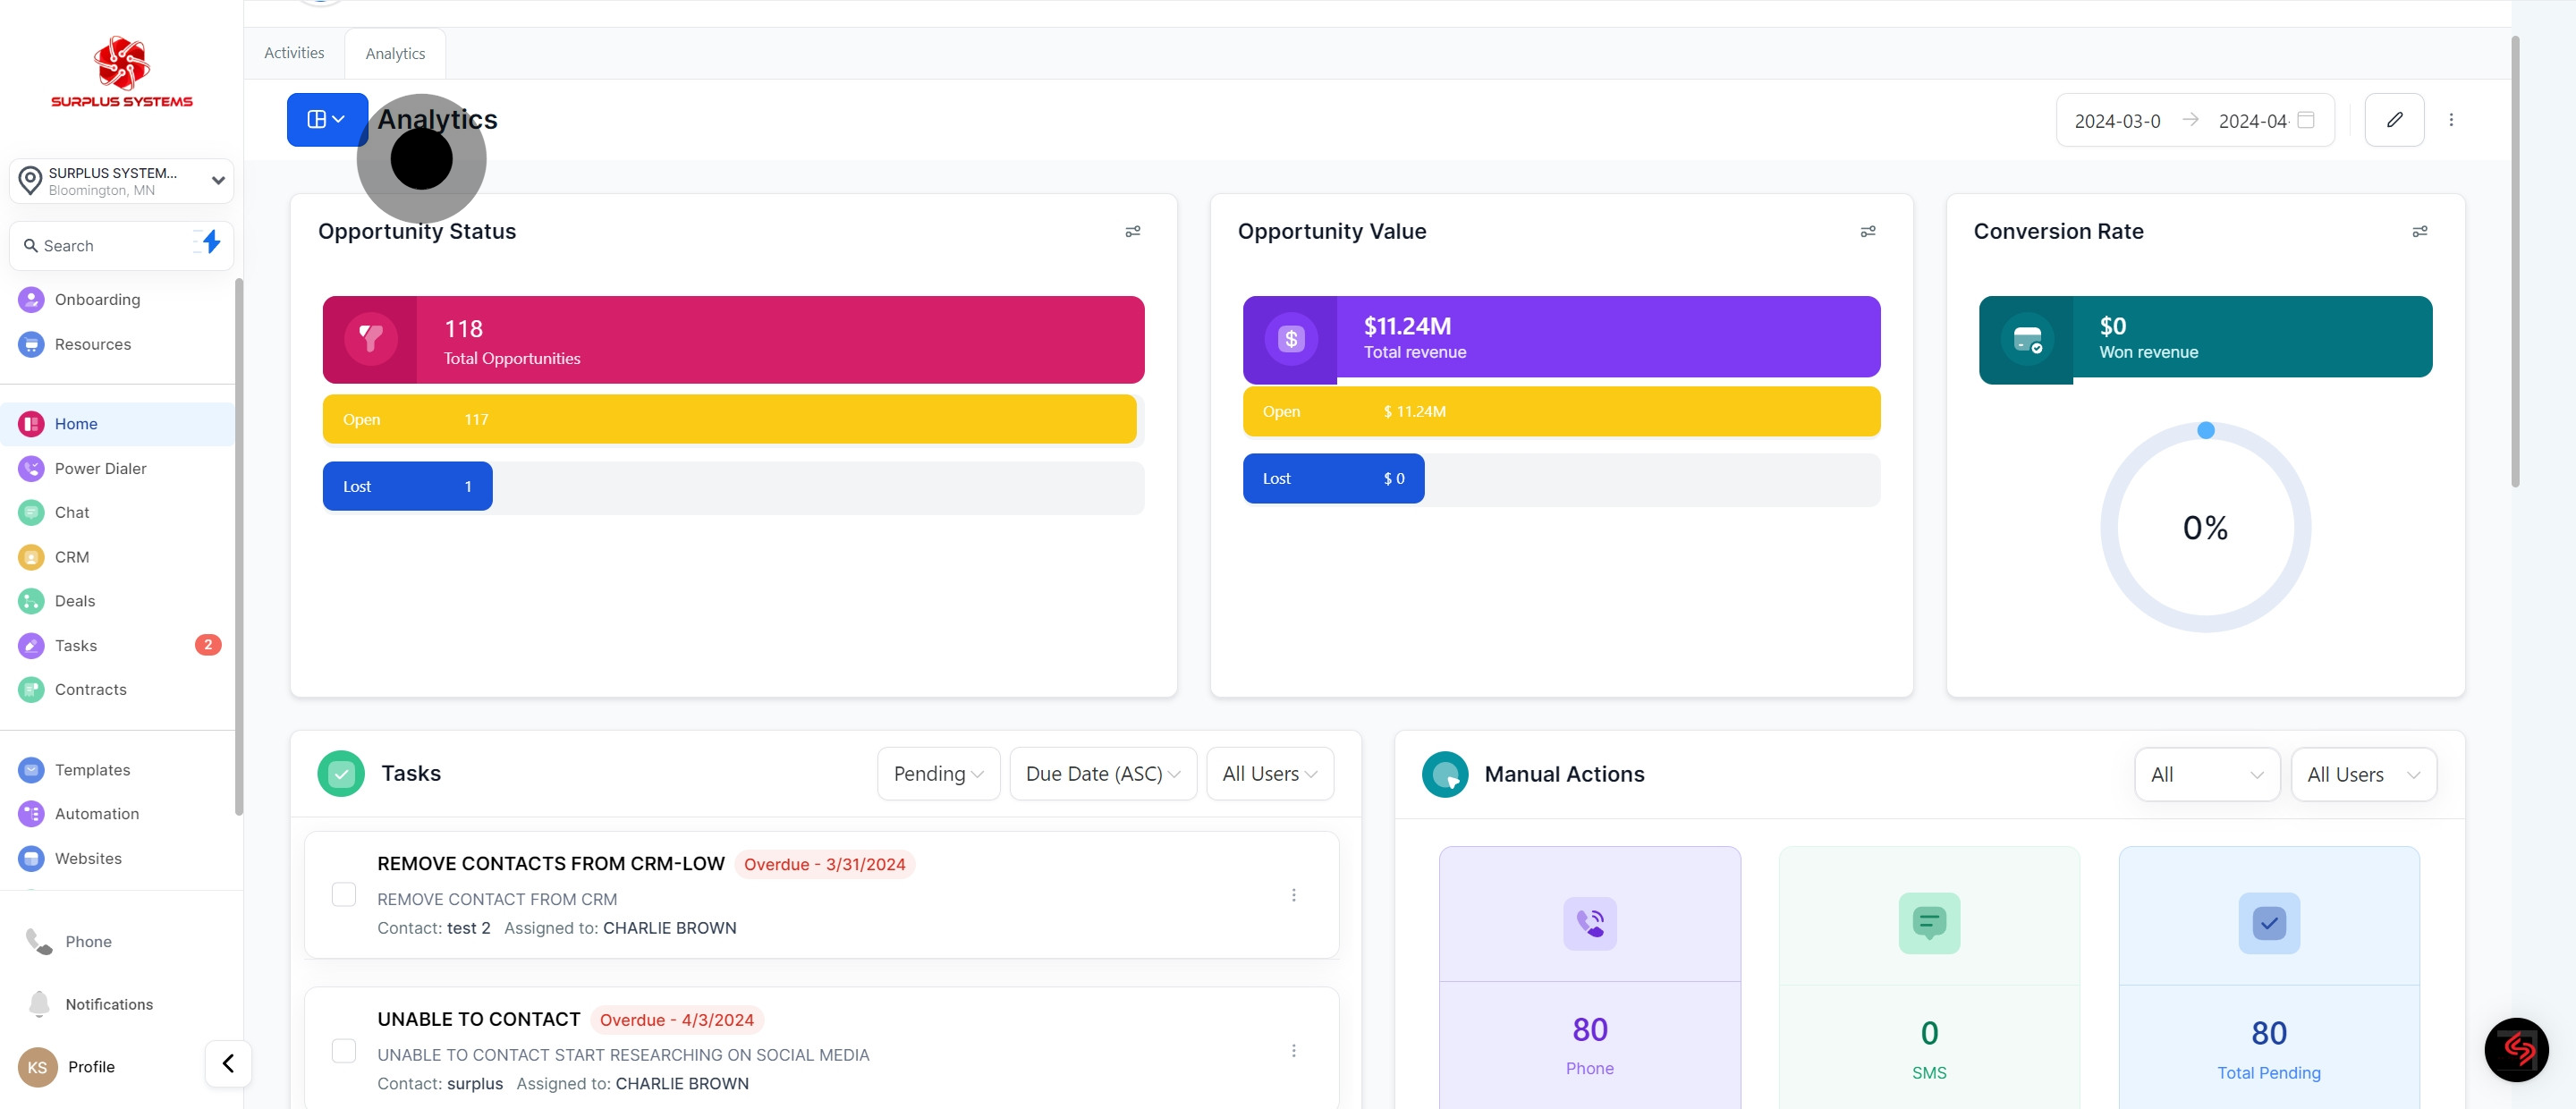
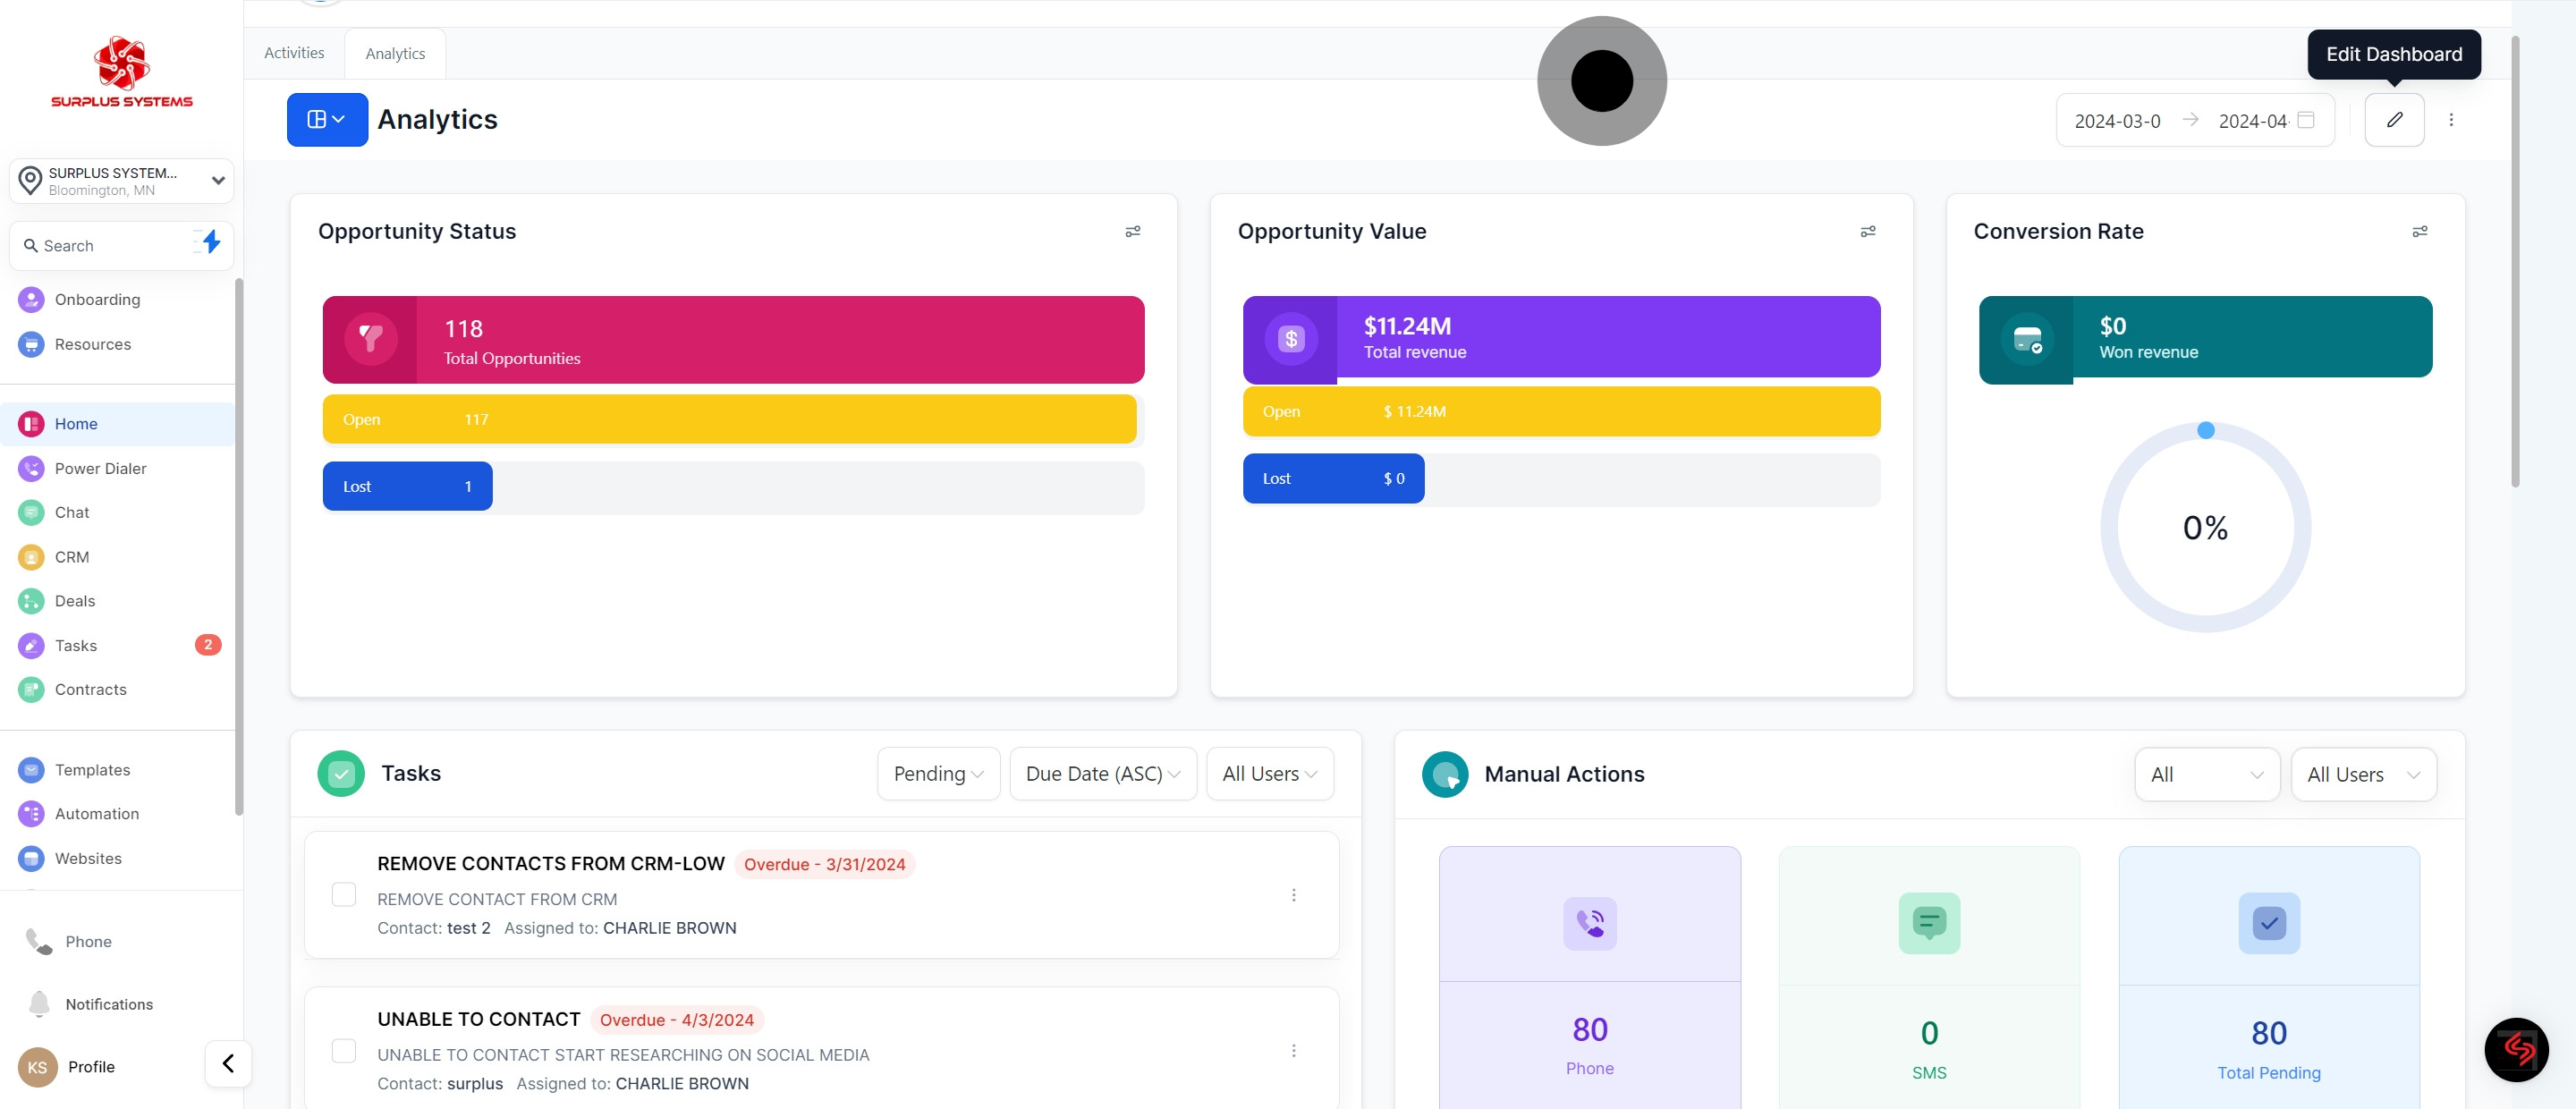
3. You can see here the Total Status of your Opportunities
4. In this area, you can see the Tally of your Opportunity Value
5. Next is the Conversion Rate
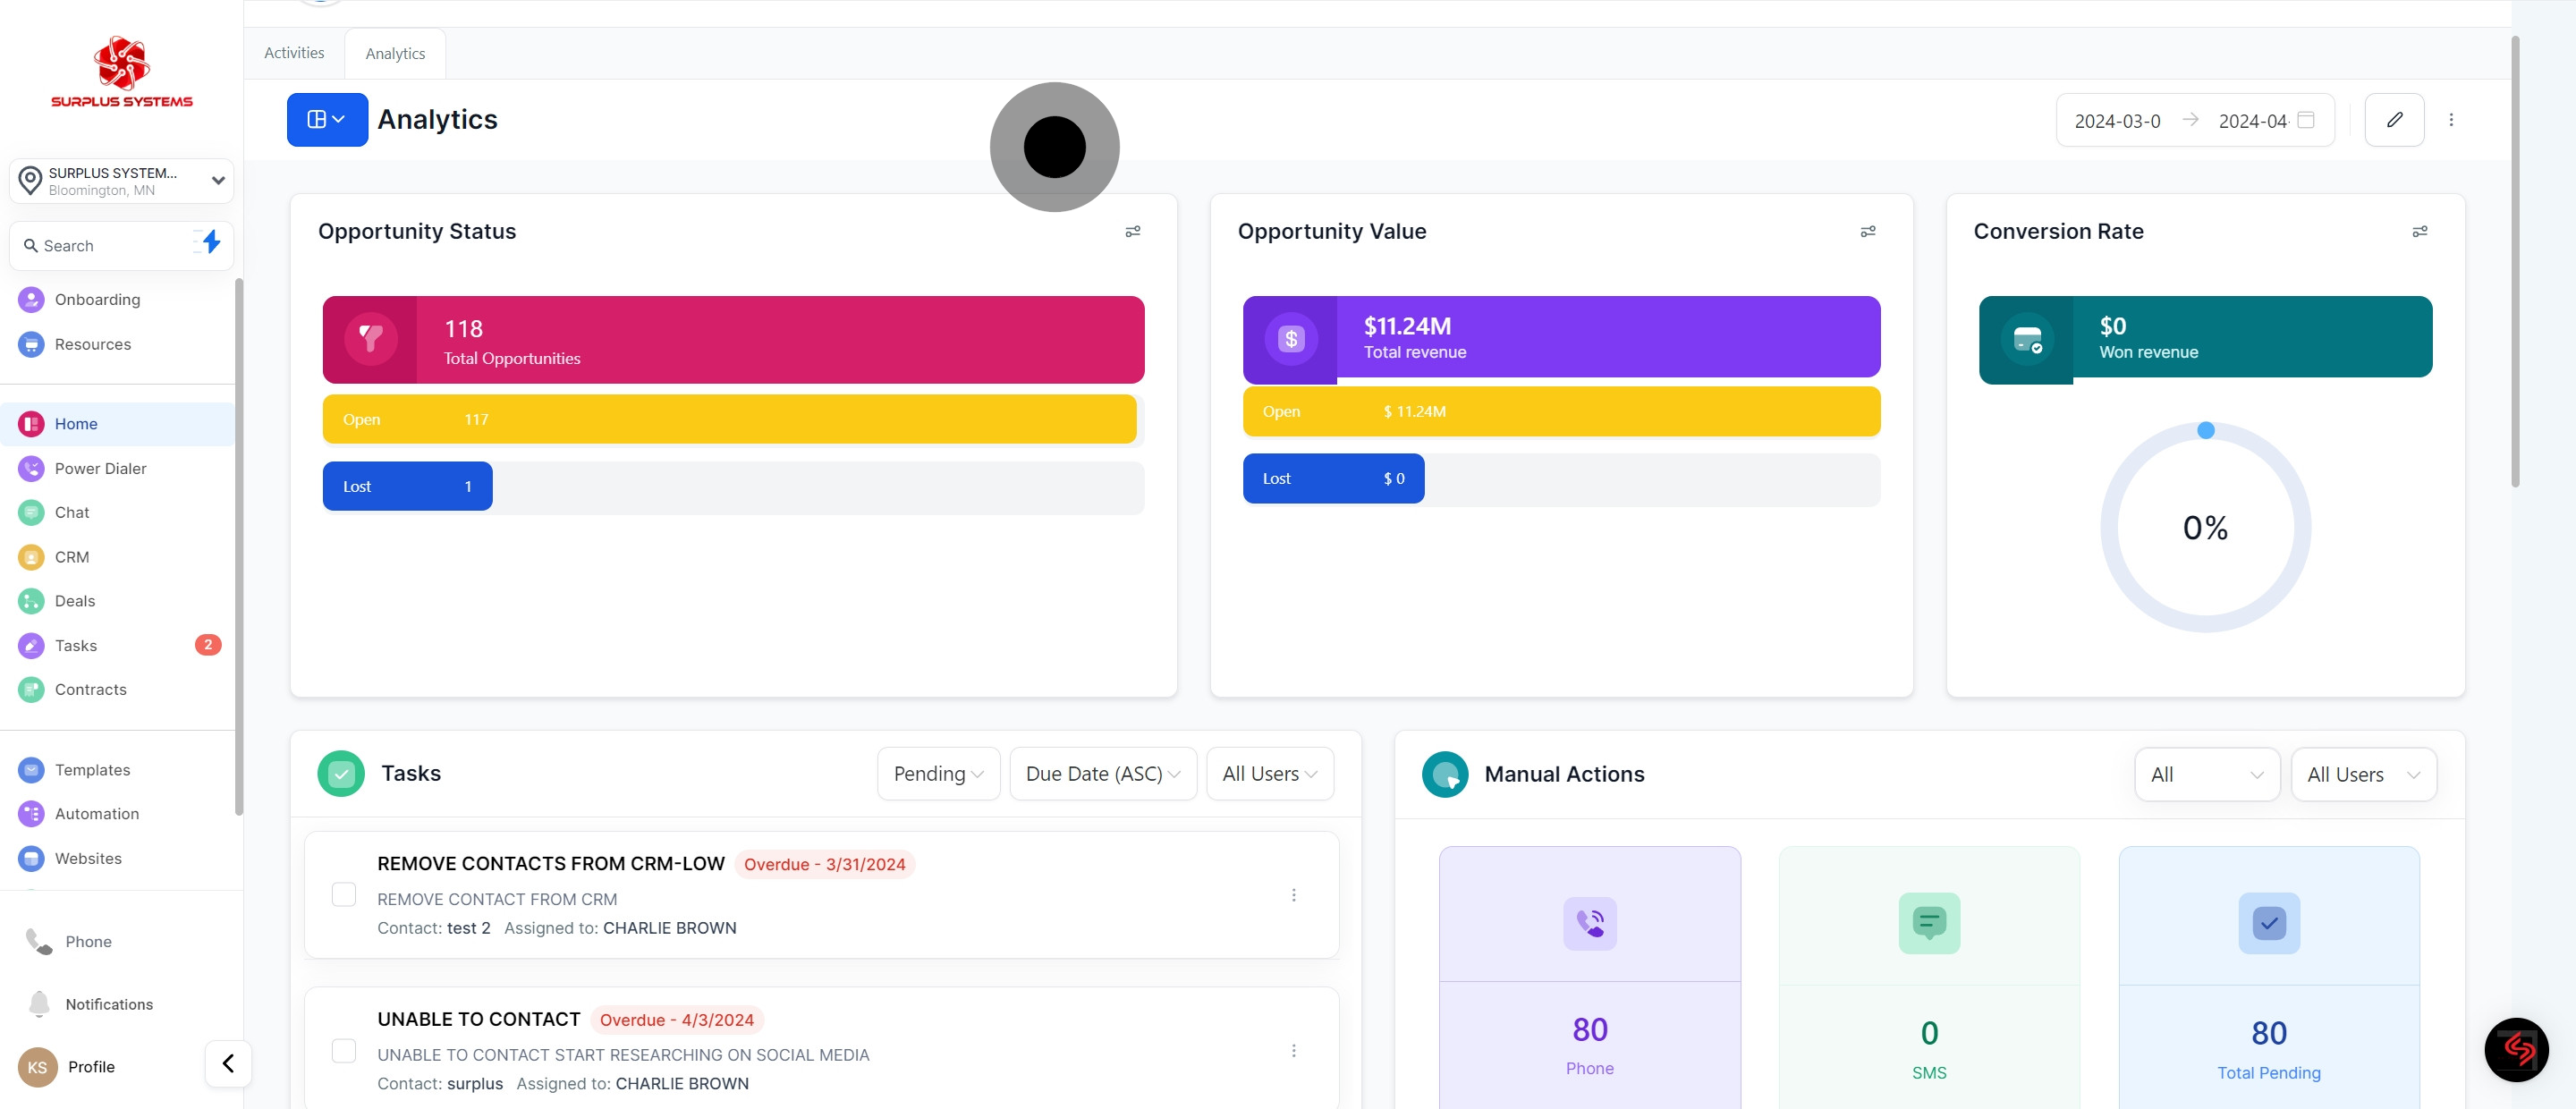
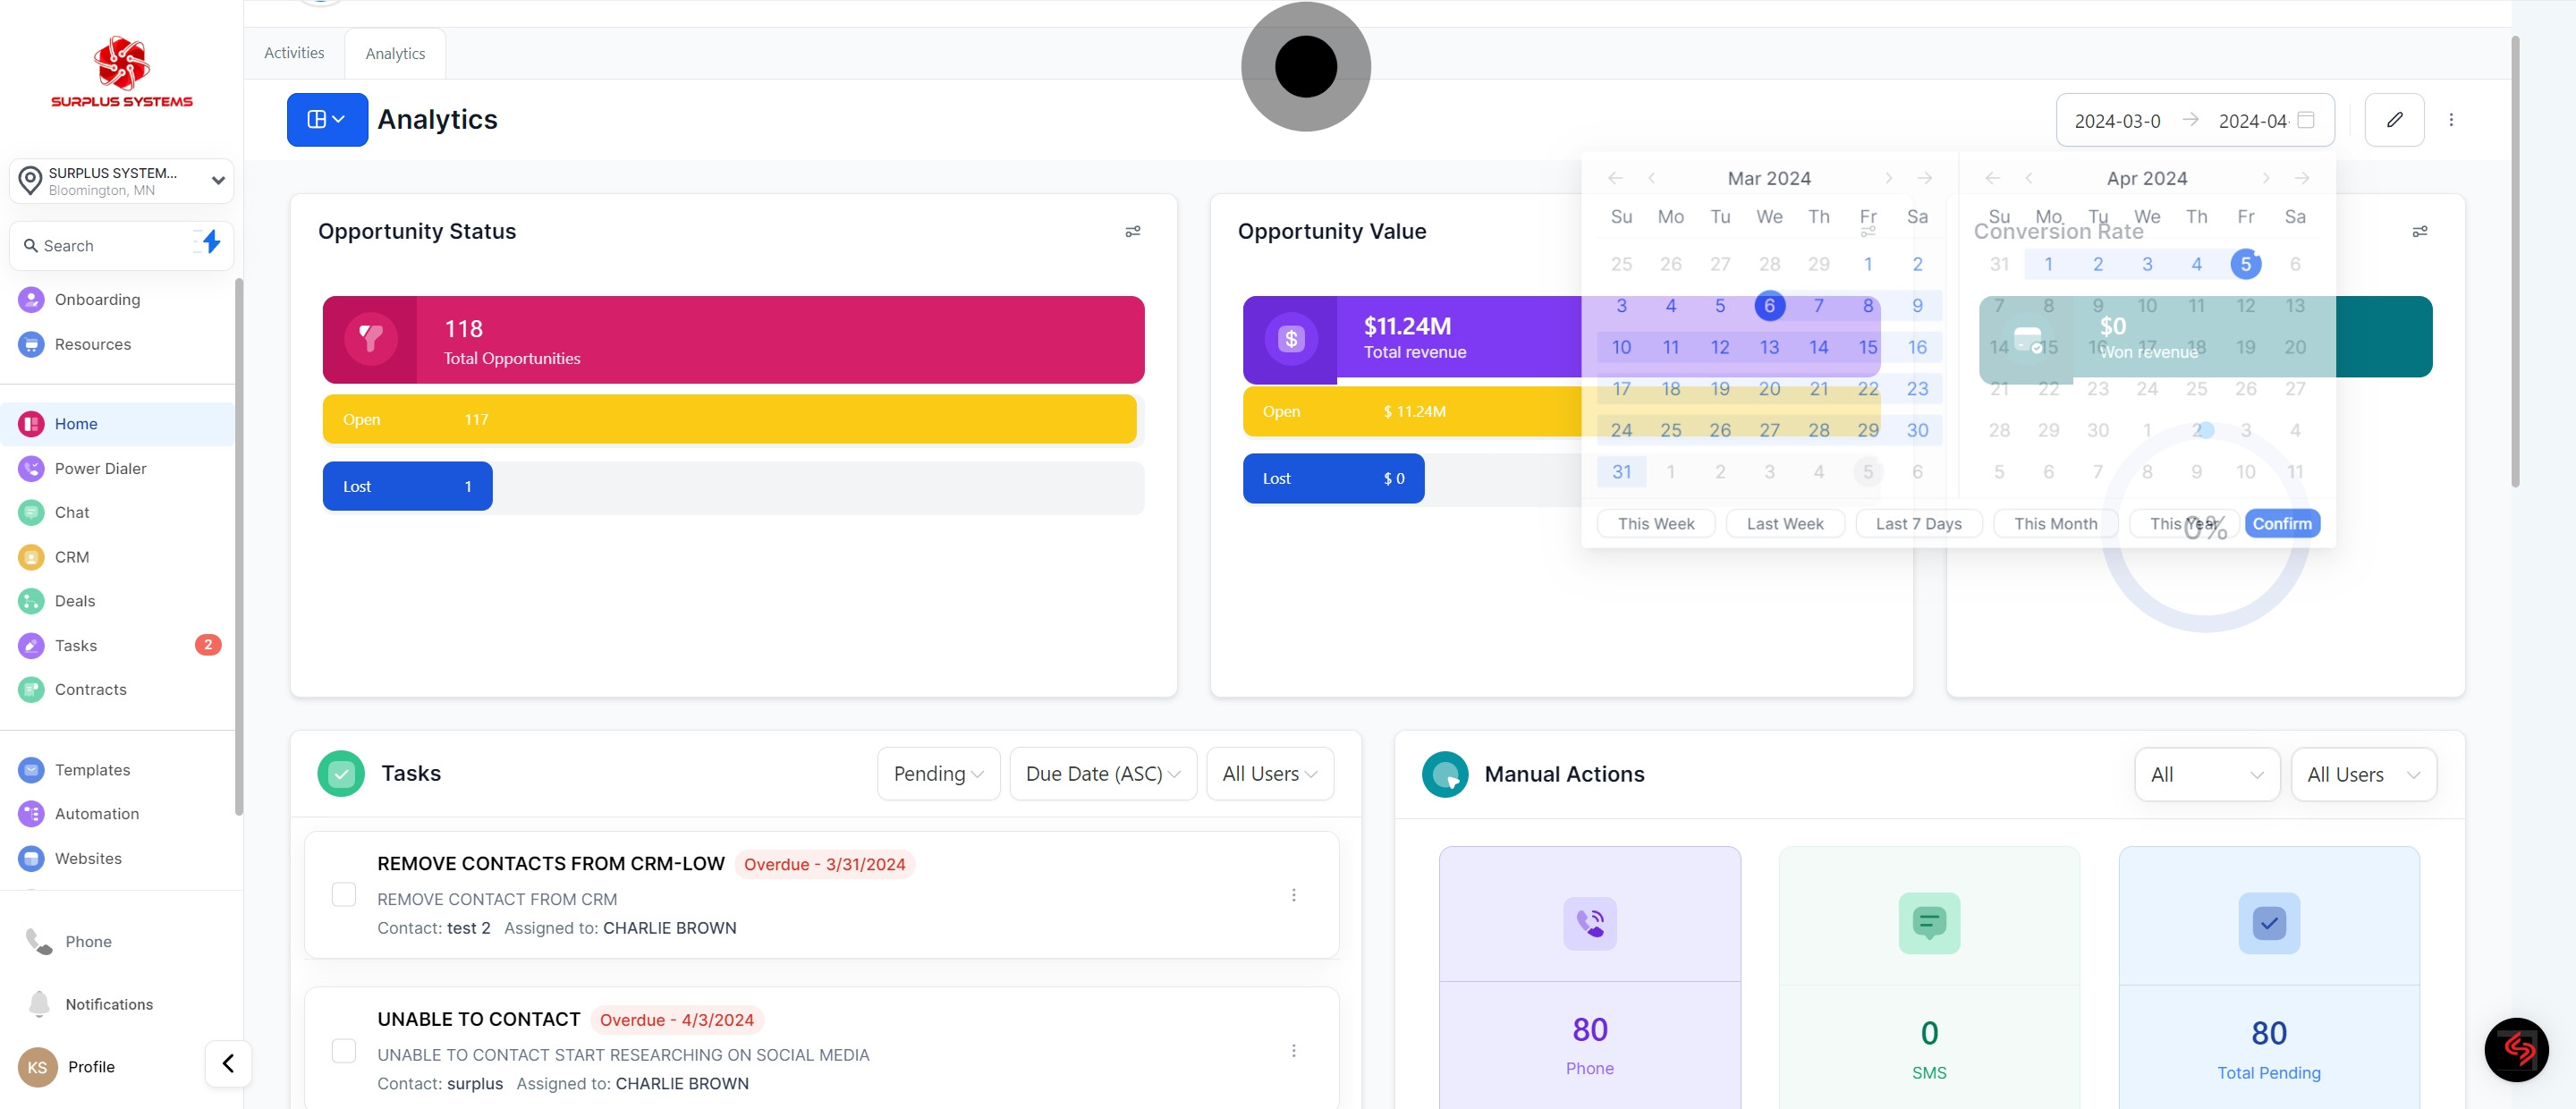
6. You can select your desired dates to filter
7. Click 'Pencil' icon to edit your dashboard
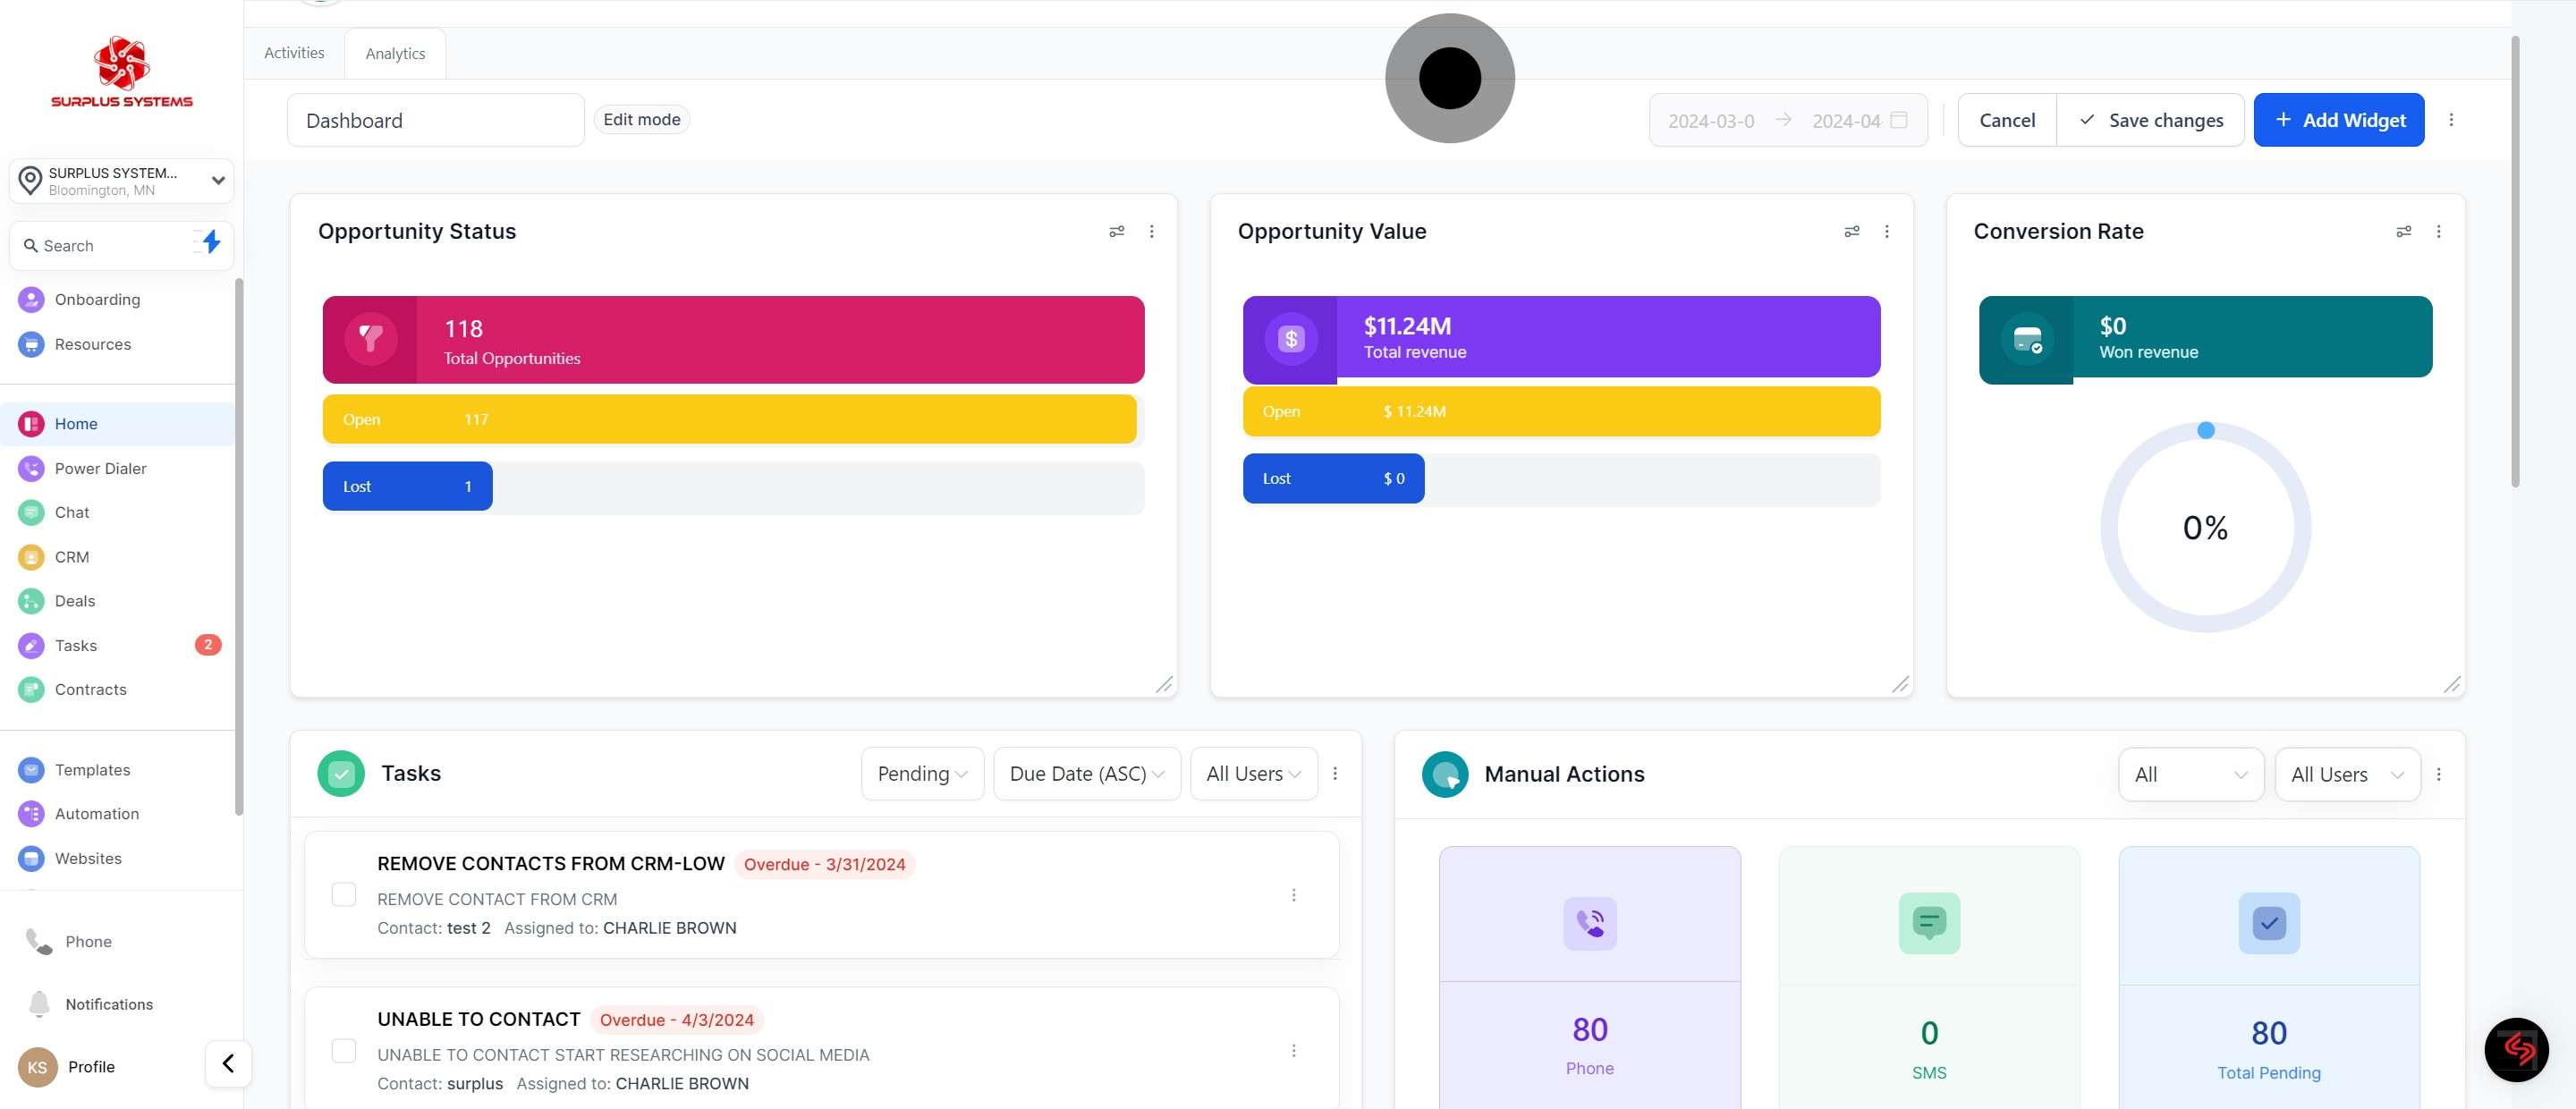
8. Click 'Save Changes' within your dashboard
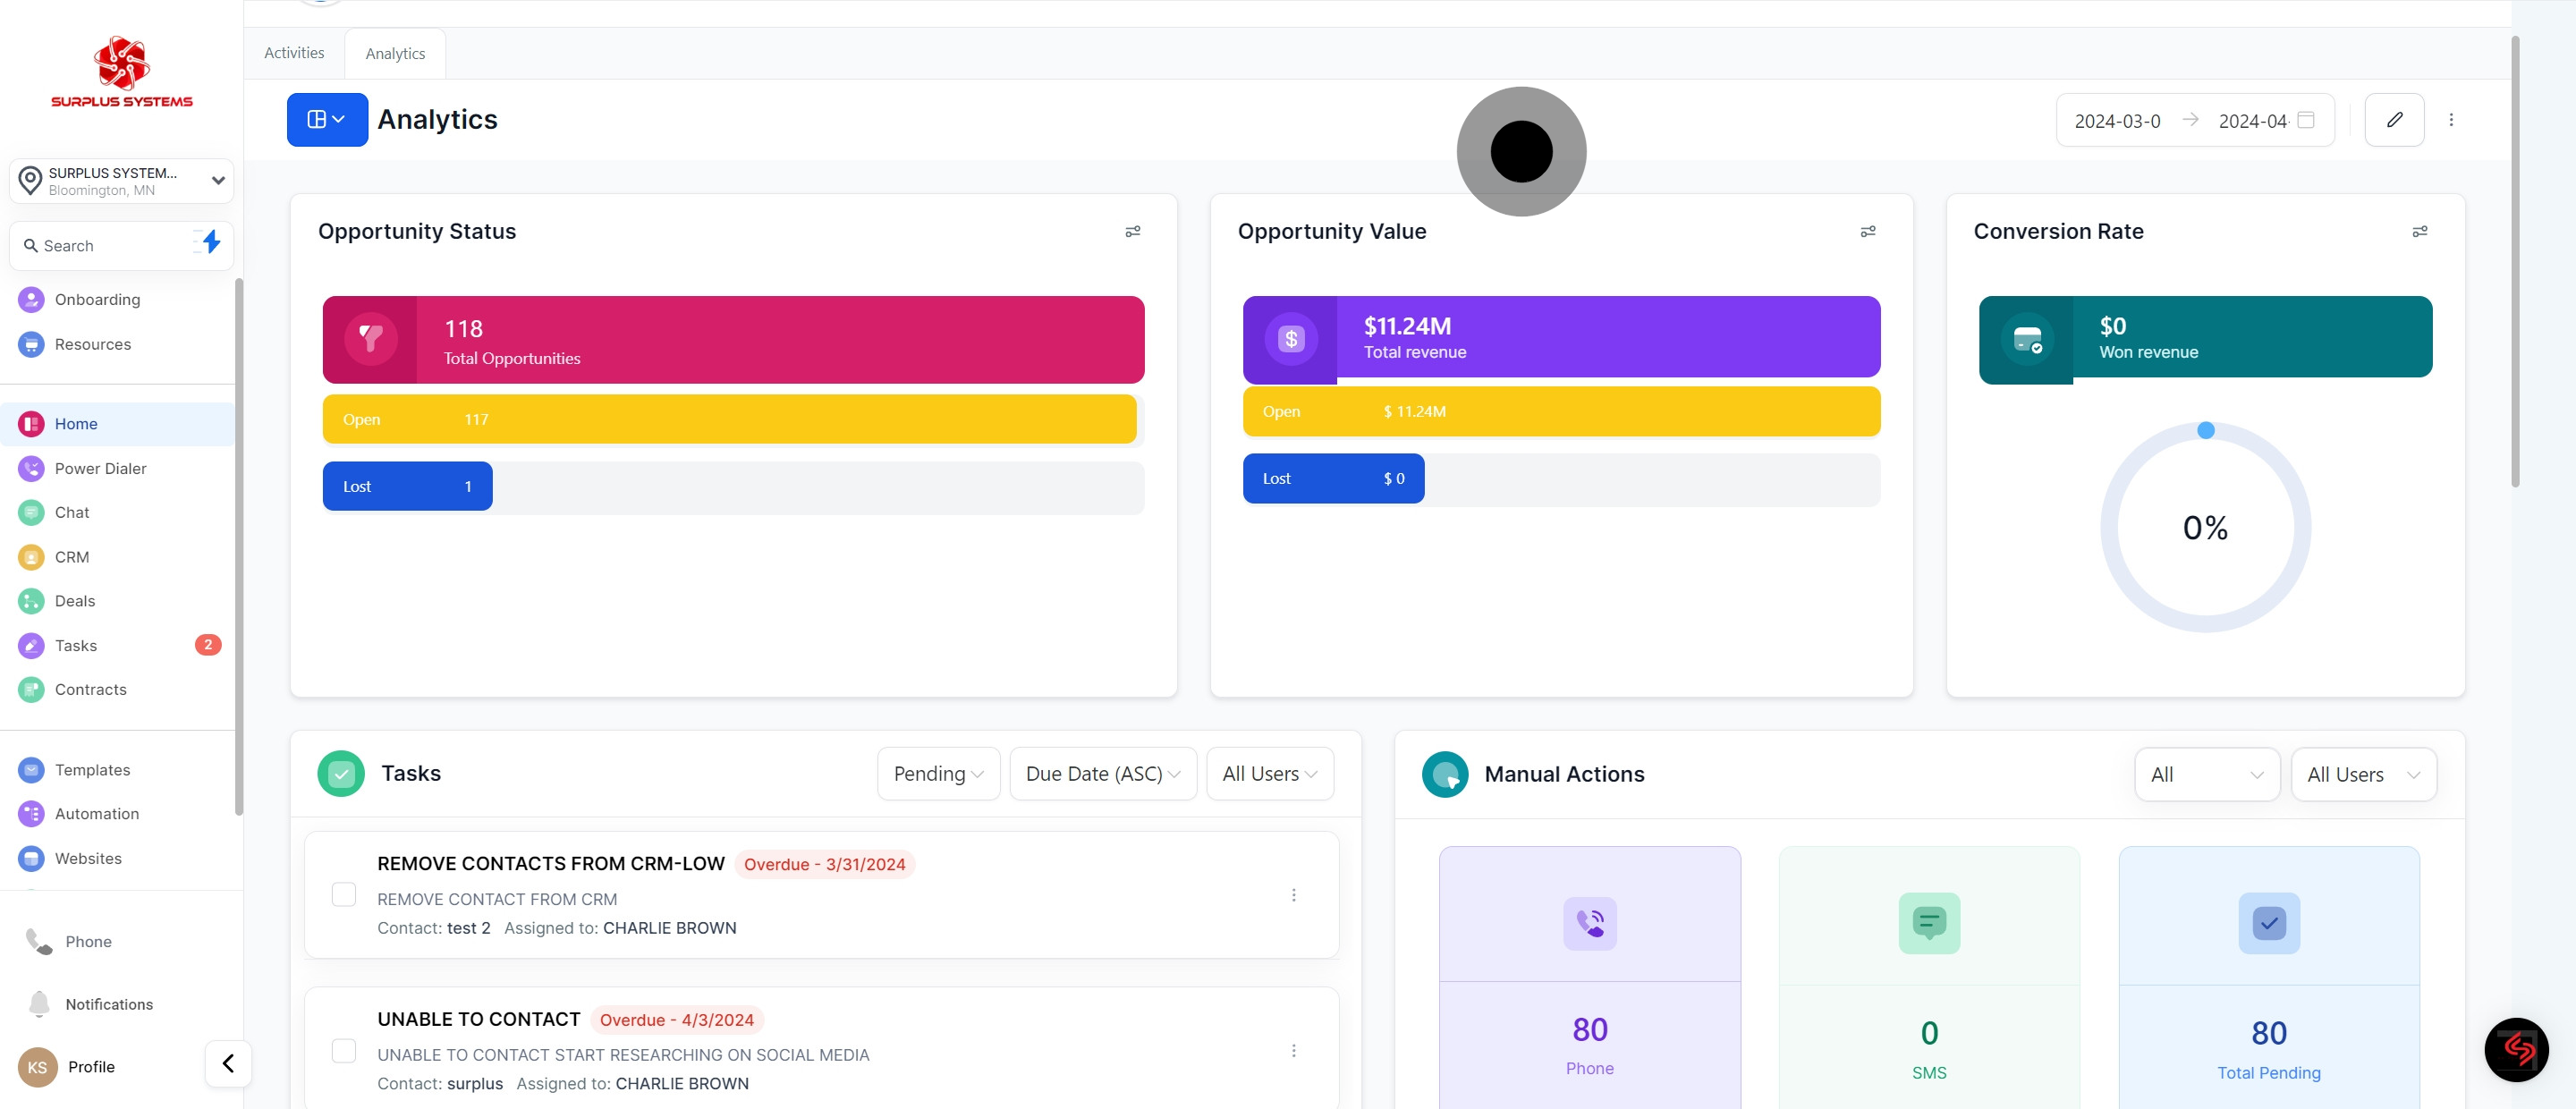
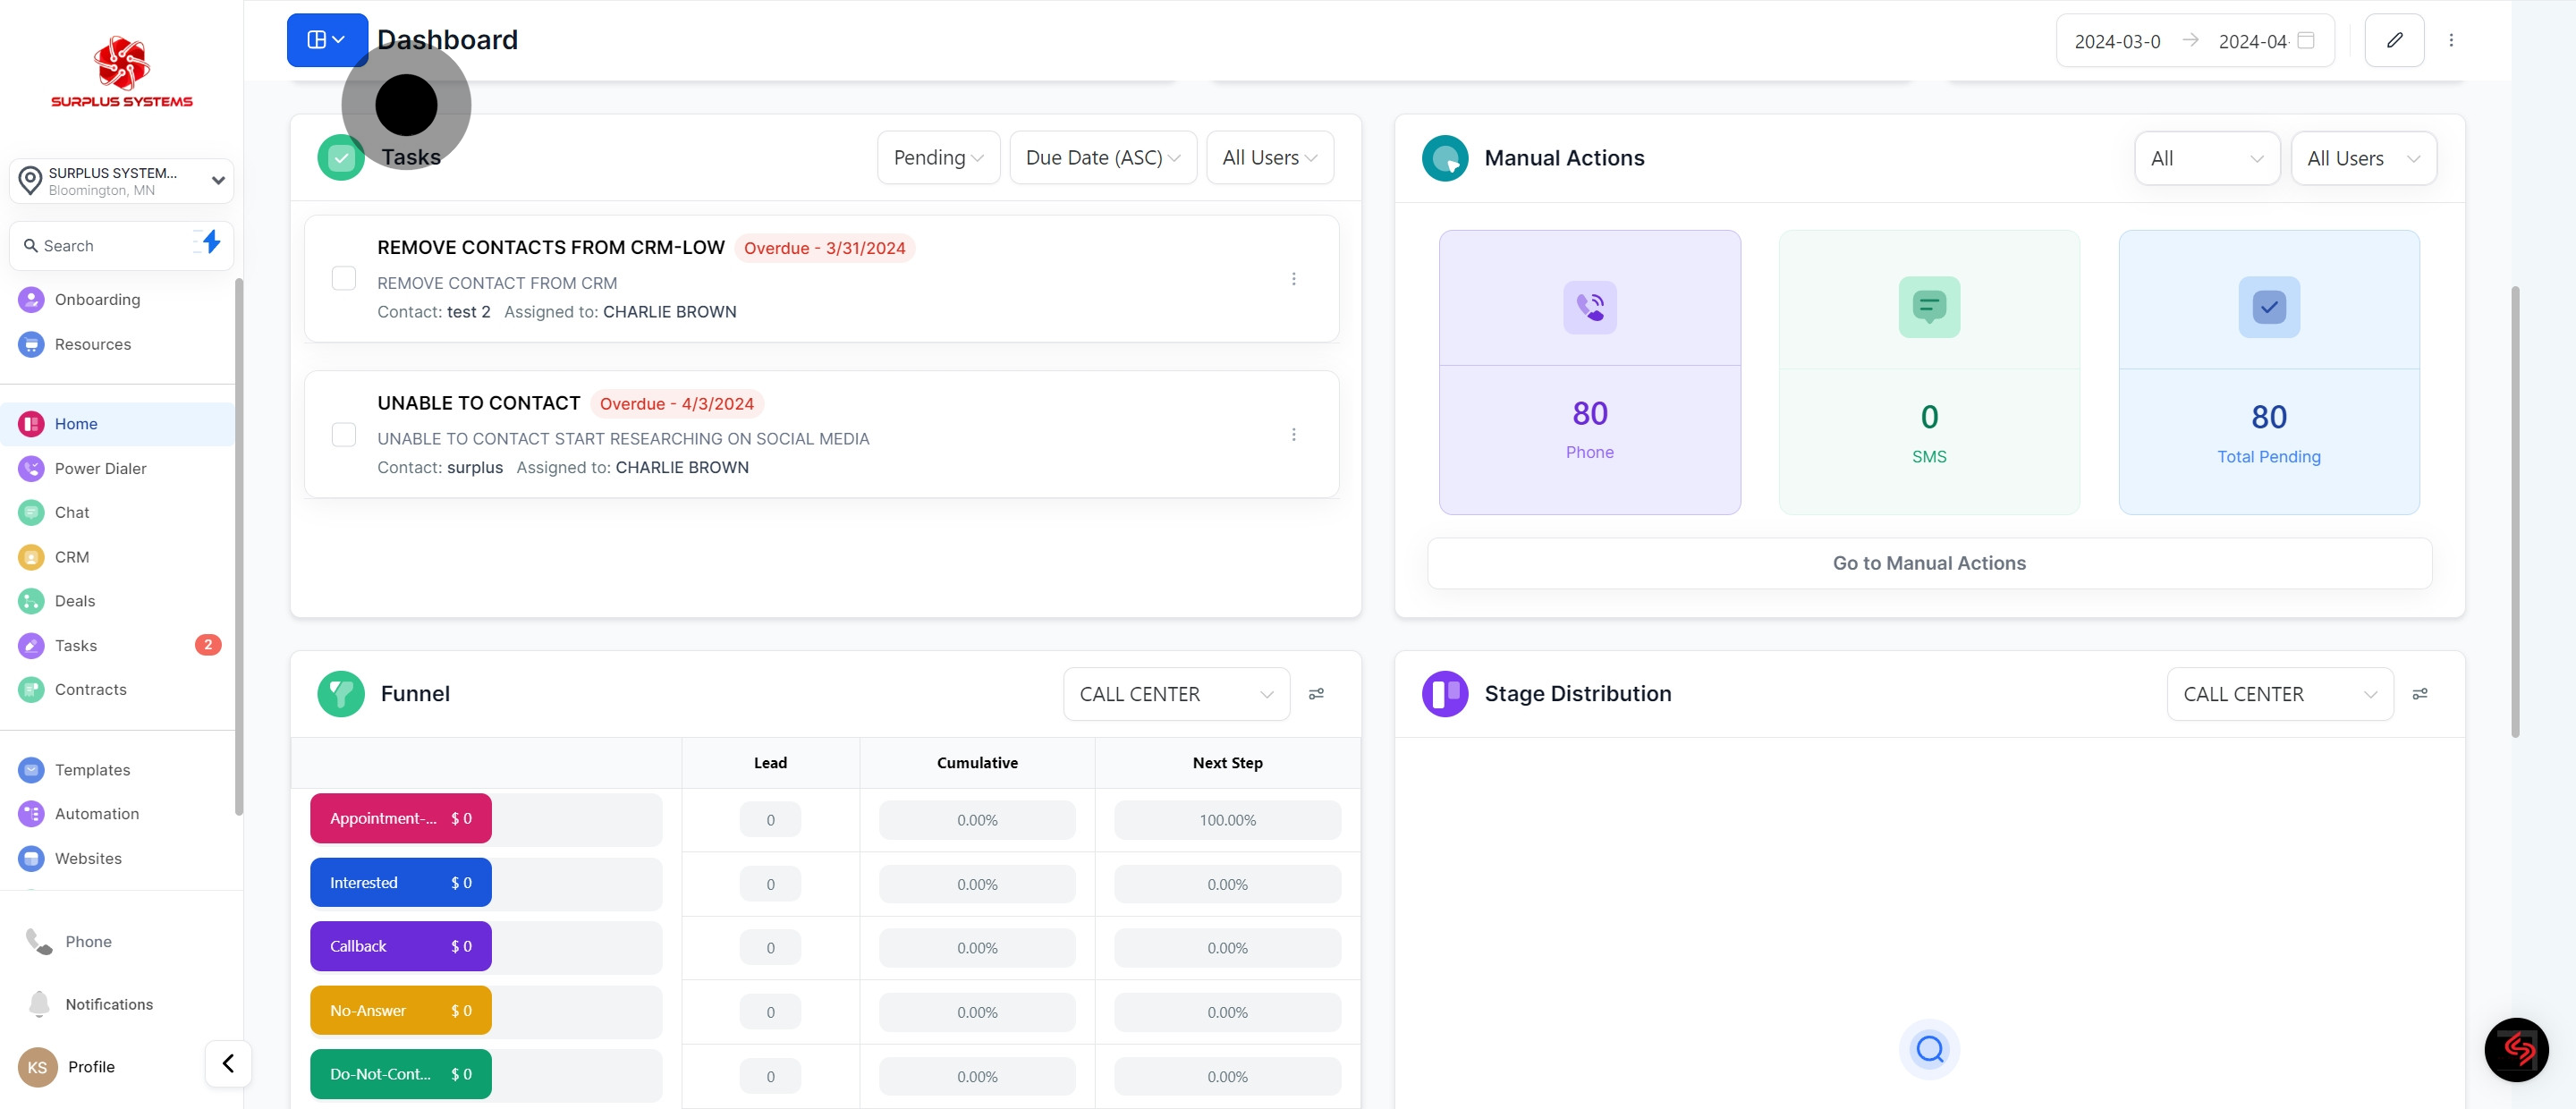
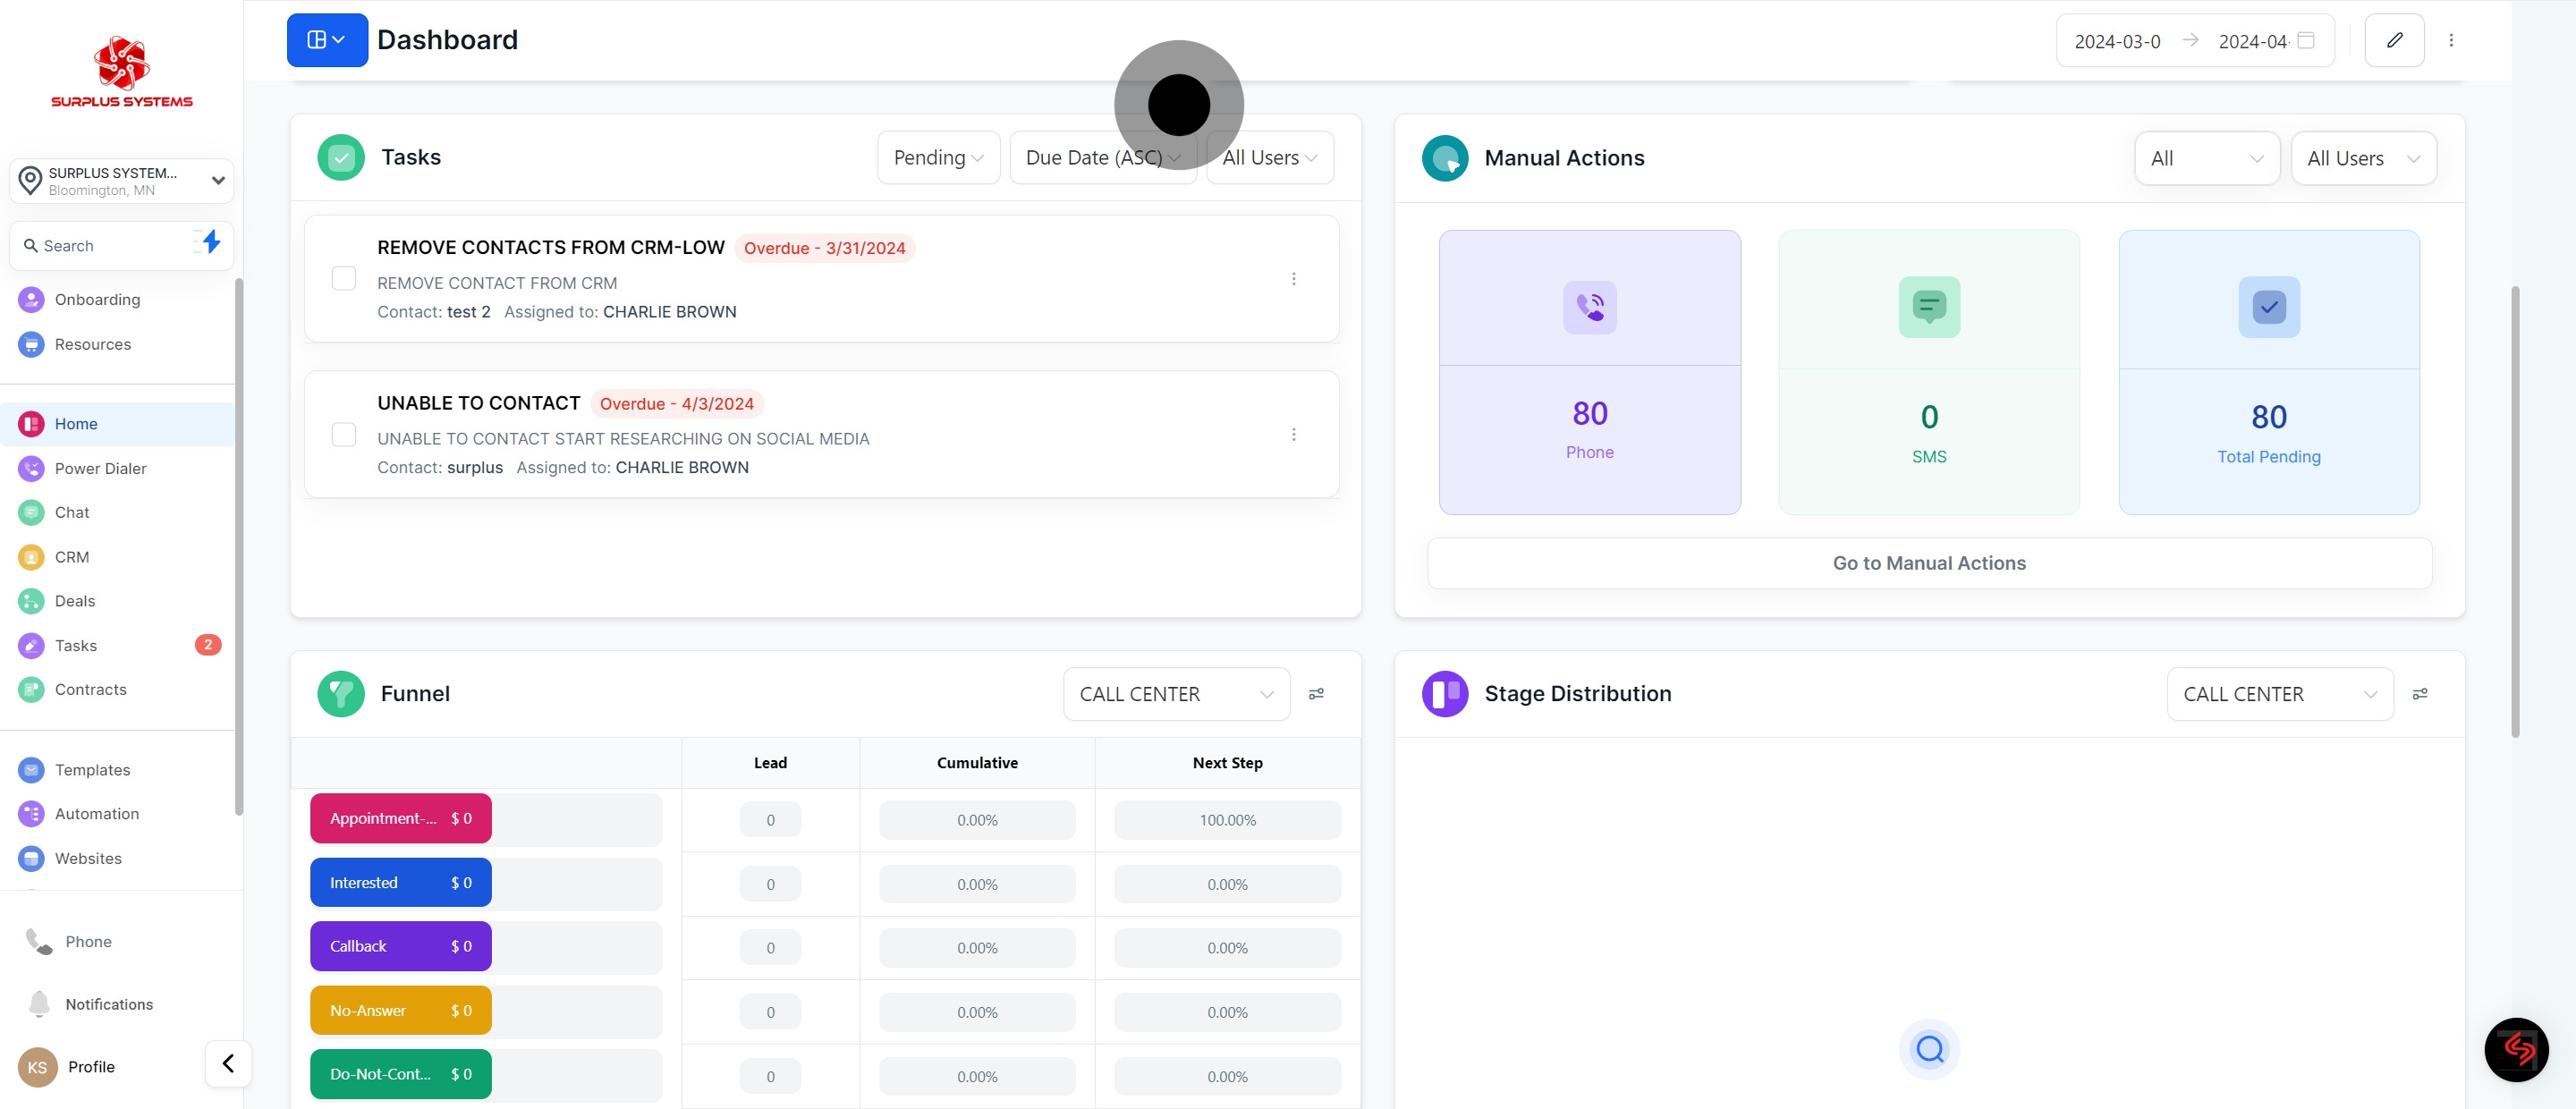
9. In this area, you can see the Tasks List
10. Then navigate to Manual Actions Overview
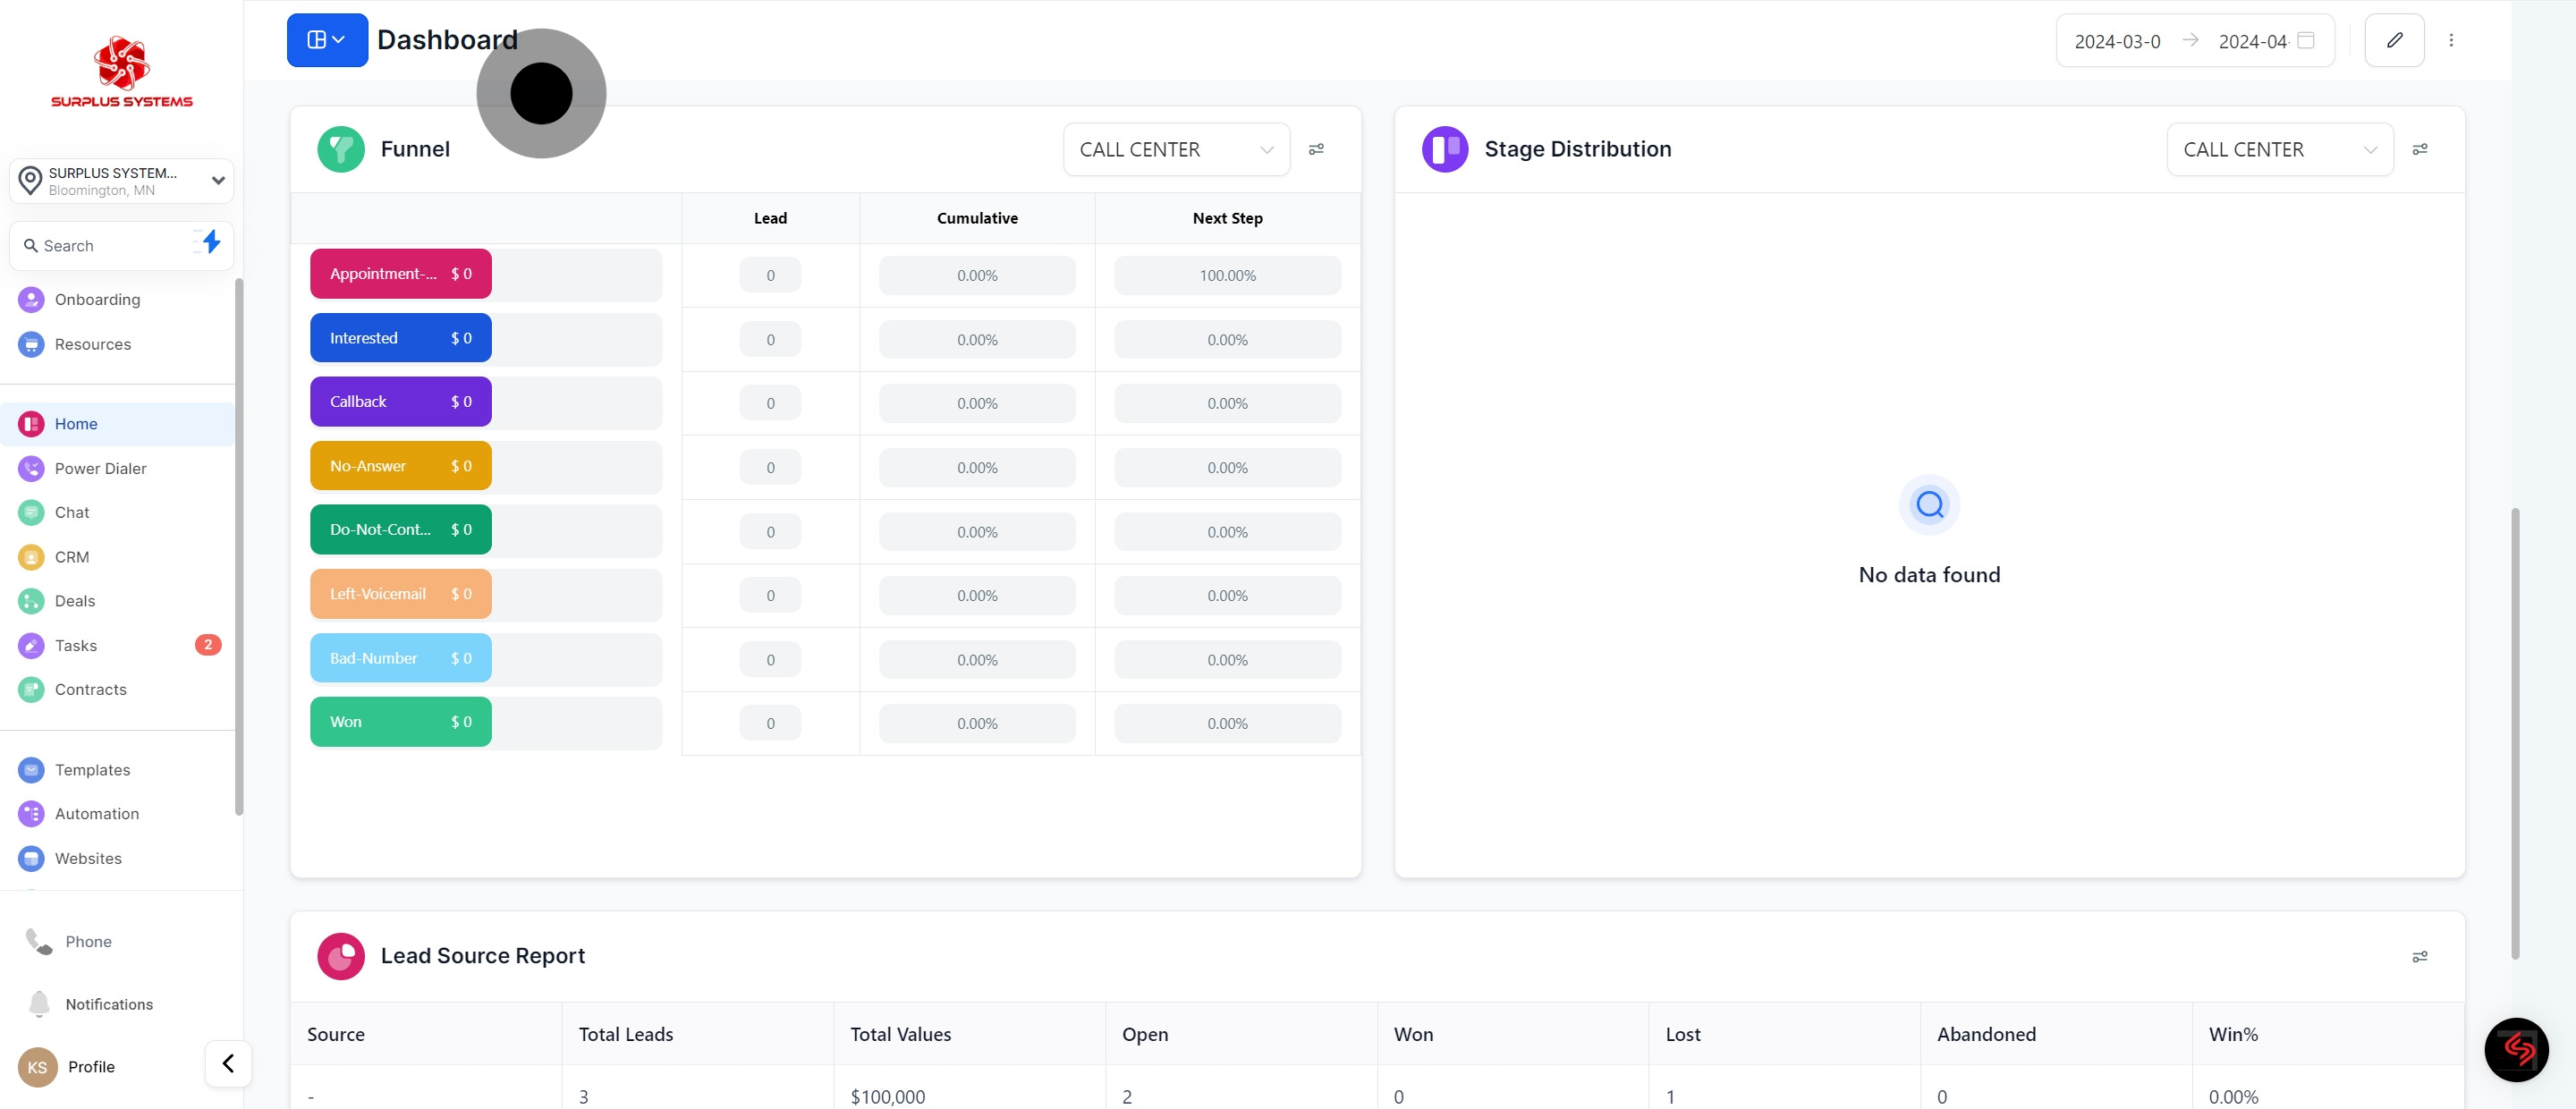
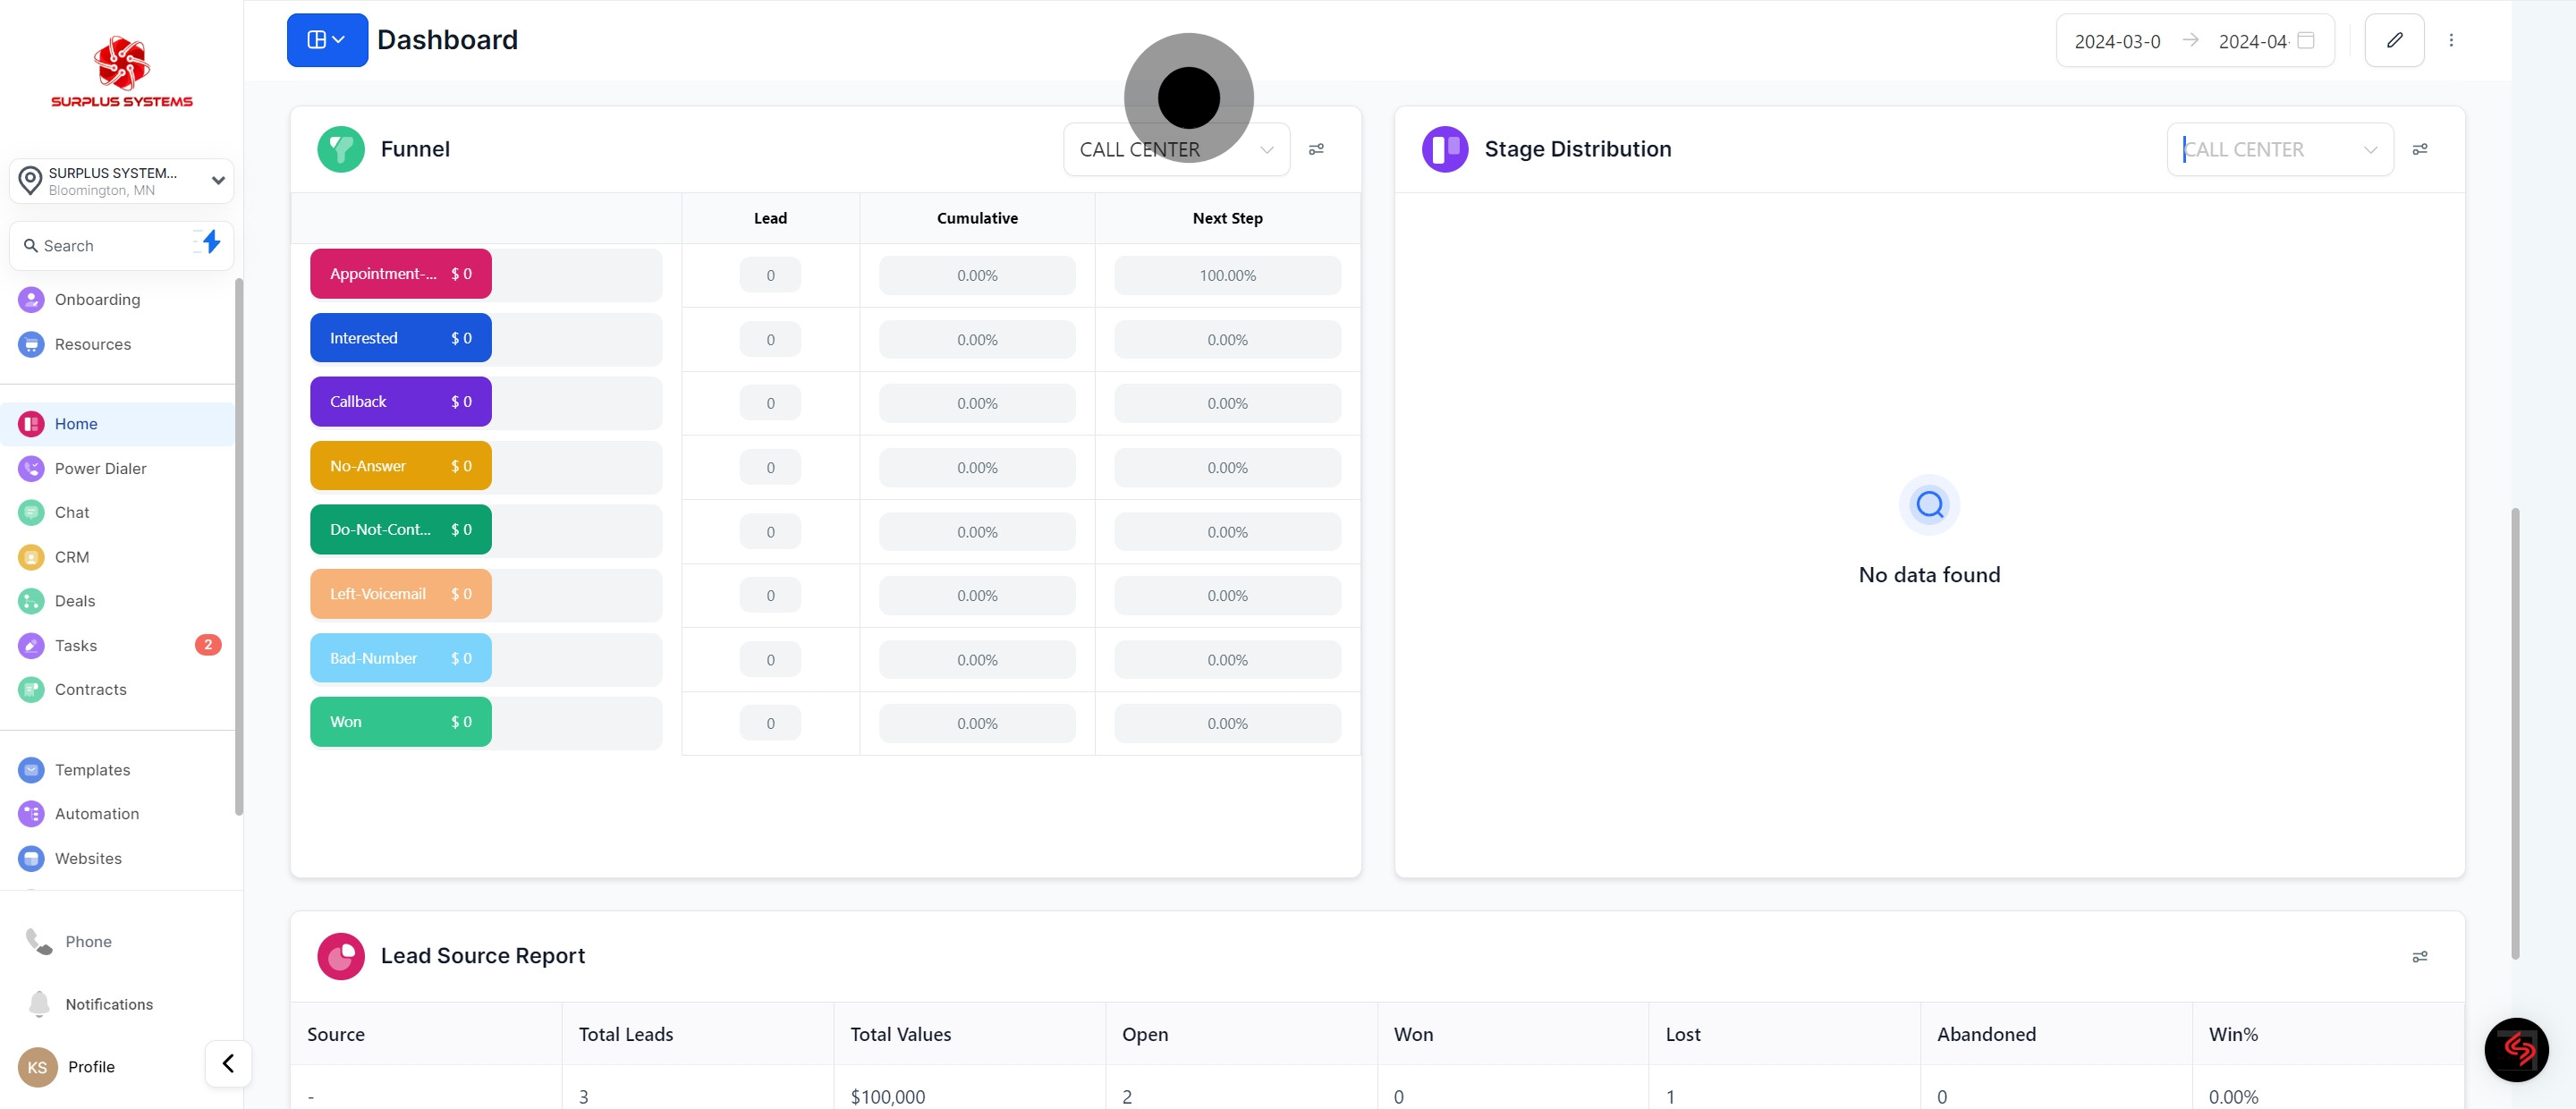
11. In here, you can see your Funnel List
12. Next, Stage Distribution area
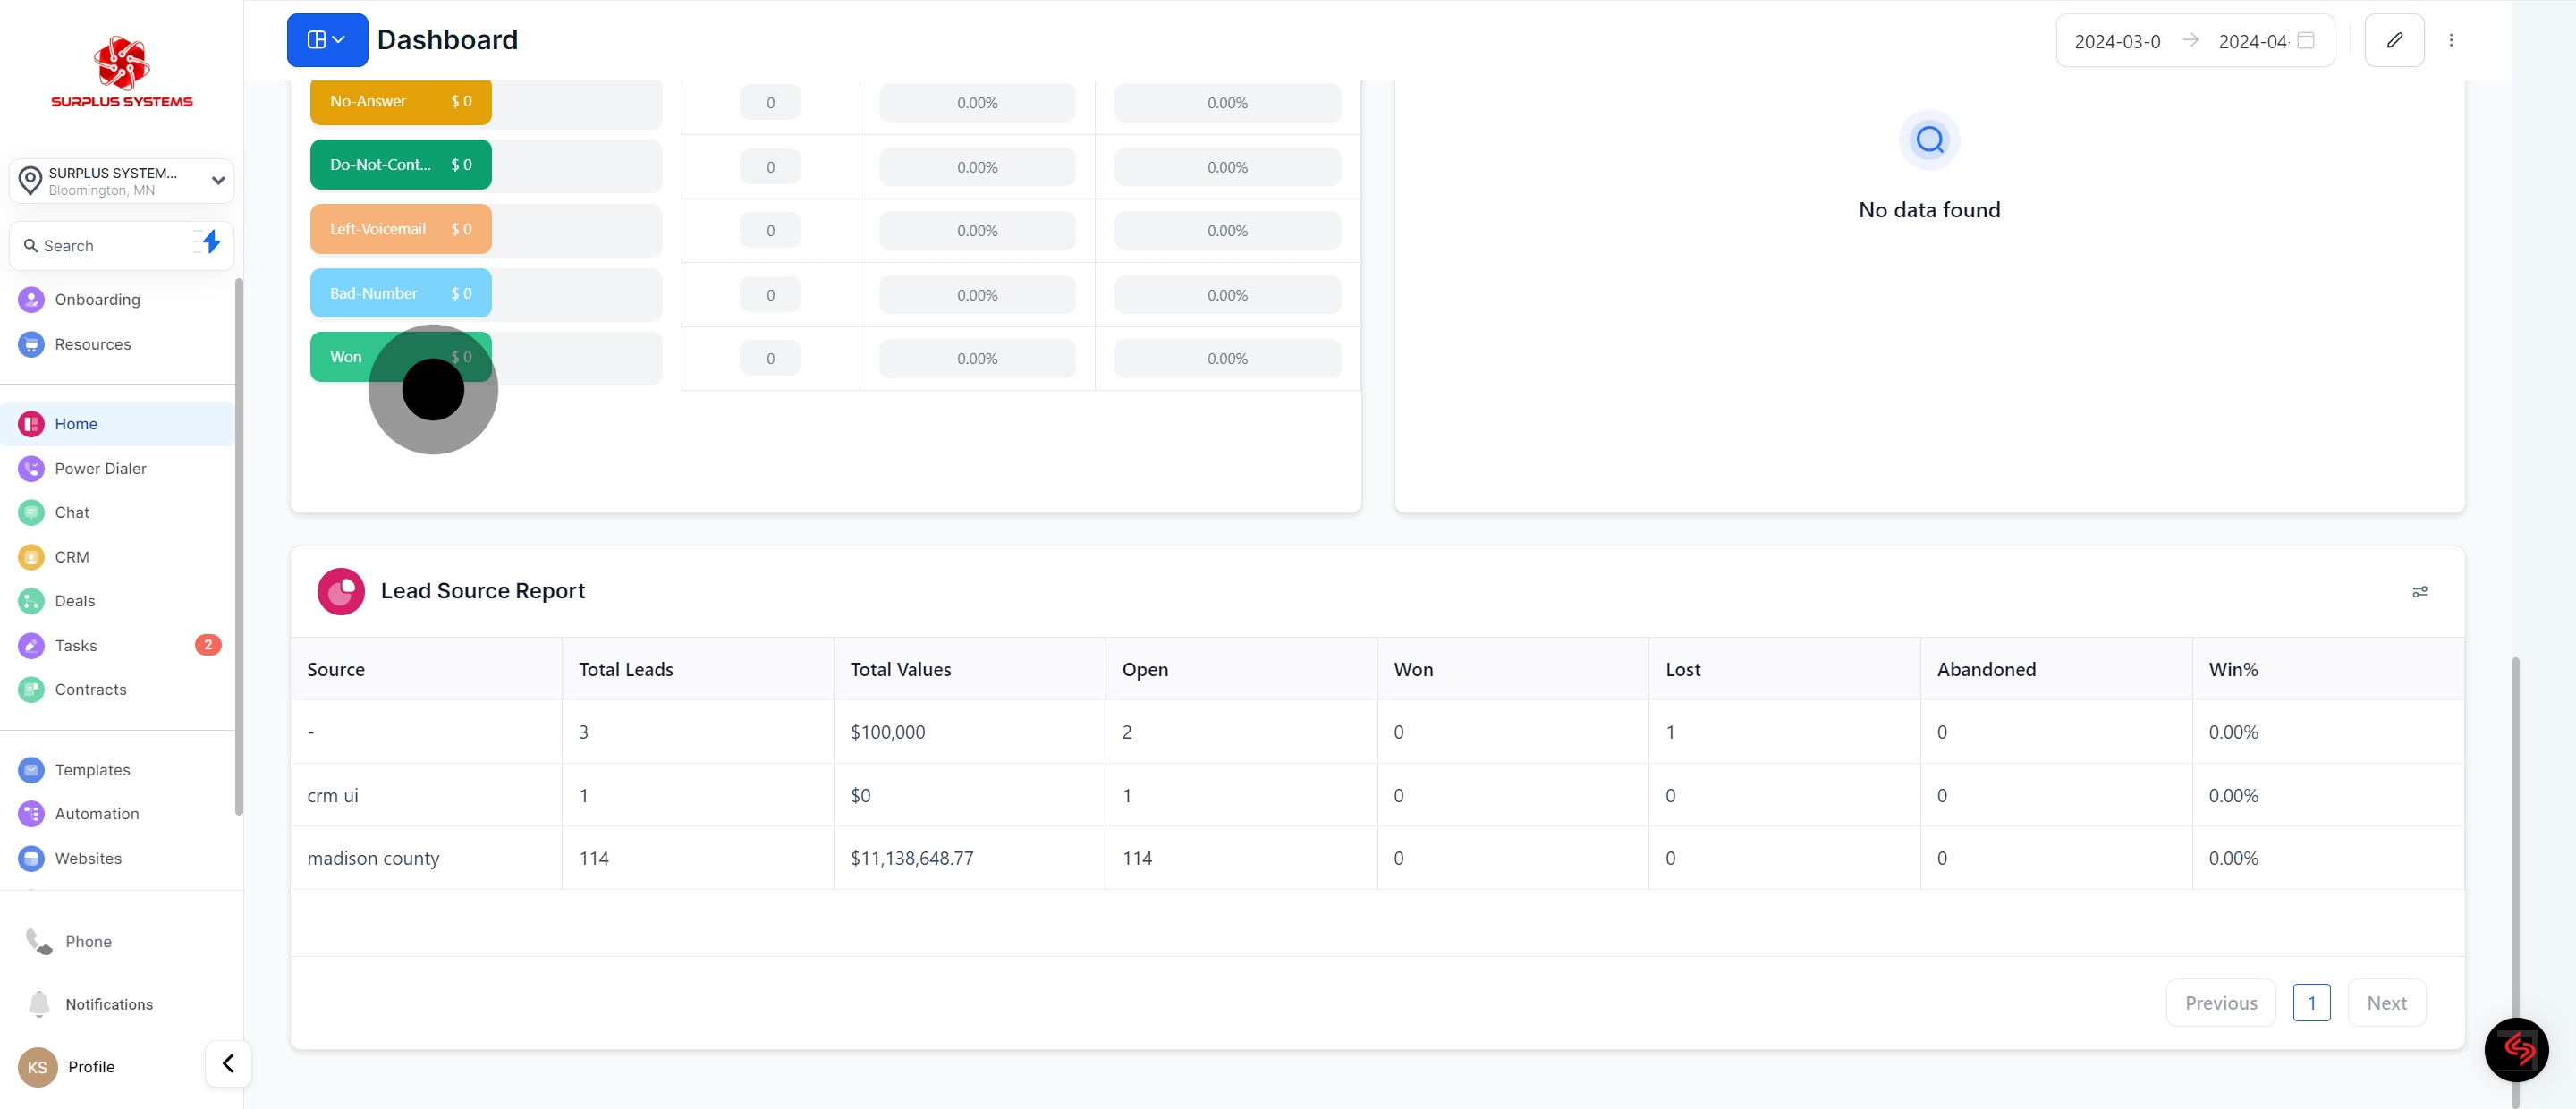
13. Finally, the Lead Source Report
Did this answer your question?
😞
😐
😁
Harnessing Dashboard Analytics in Surplus Systems | SURPLUS SYSTEMS