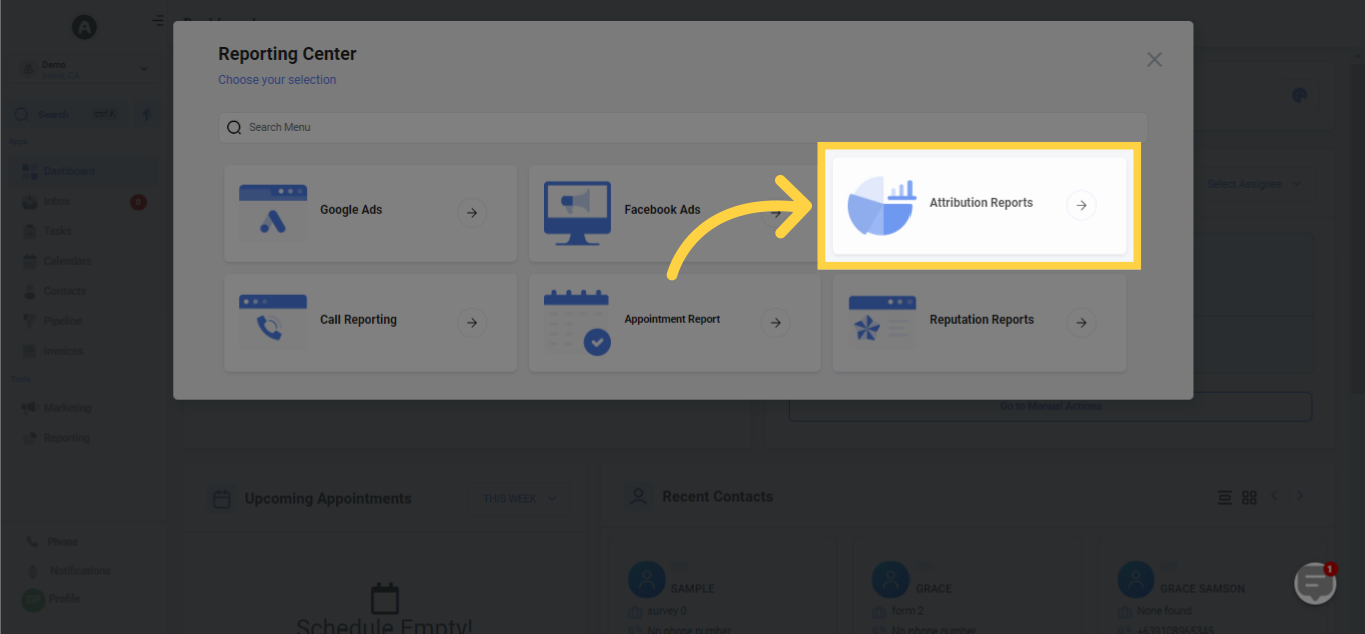
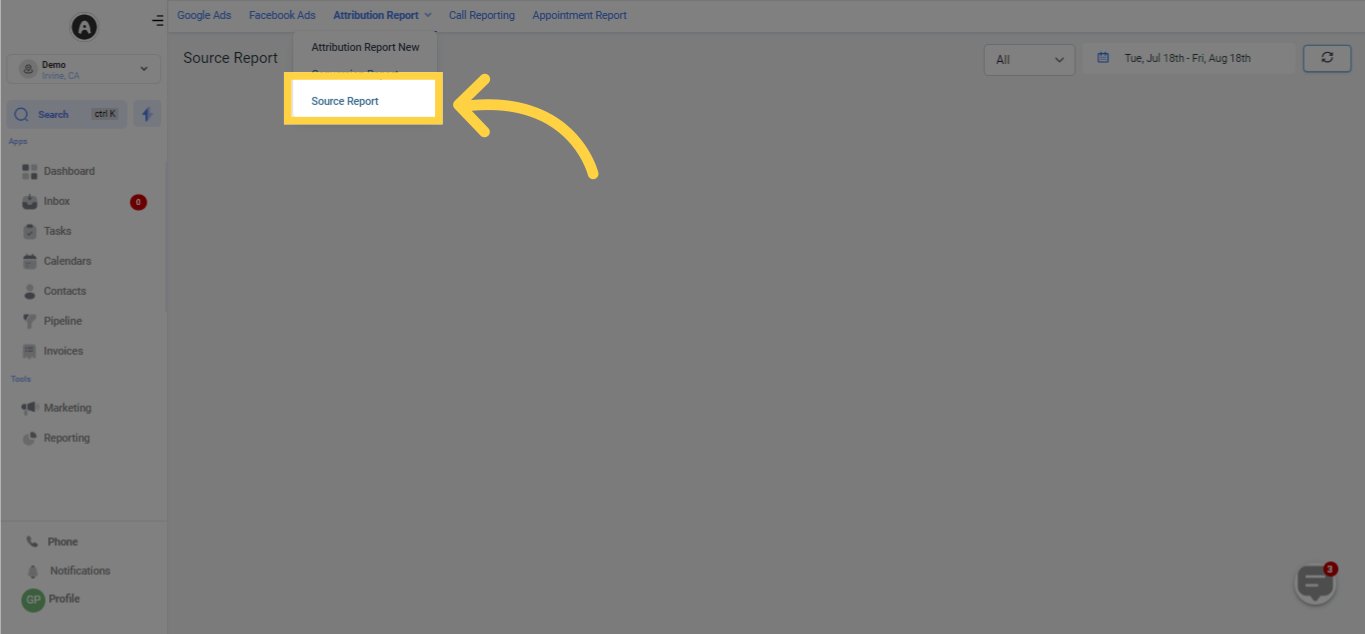
Inside the Attribution Report, you will find a segment called the Source Report. In this section, you are able to monitor and evaluate the income produced and the proportion of total sales according to different metrics, including contacts in your CRM, opportunities, and sessions.
Further, this section showcases the origins of your conversions and the attribution associated with each source. This offers a more in-depth understanding compared to the Conversion Report.
IMPORTANT: Your accessibility to all of the components may vary based on your user permissions.
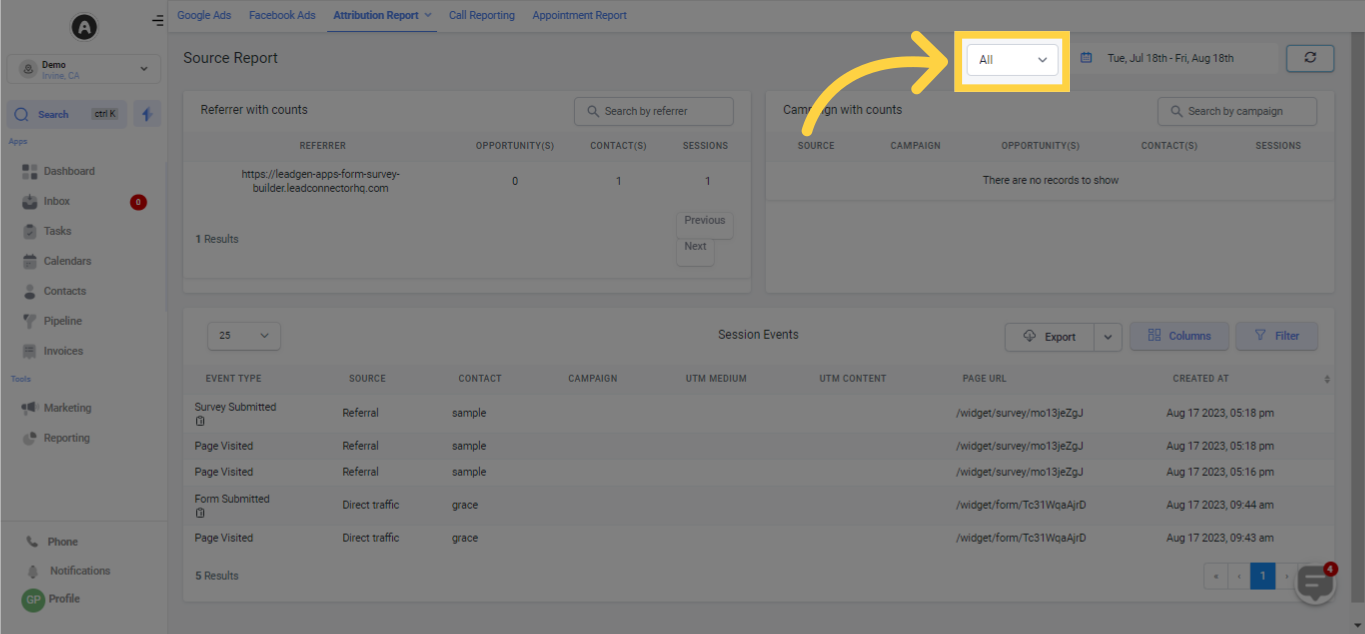
Choose the kind of data you want to incorporate in your attribution reports to acquire critical information that is adjusted to your particular requirements. Your options include Forms, Surveys, or Calendars.
By opting for Forms or Surveys, you will be able to evaluate the effectiveness of diverse lead generation forms present on your website.
Alternatively, if you select the Calendars option, you can examine how scheduled events and appointments influence customer engagement and conversions.
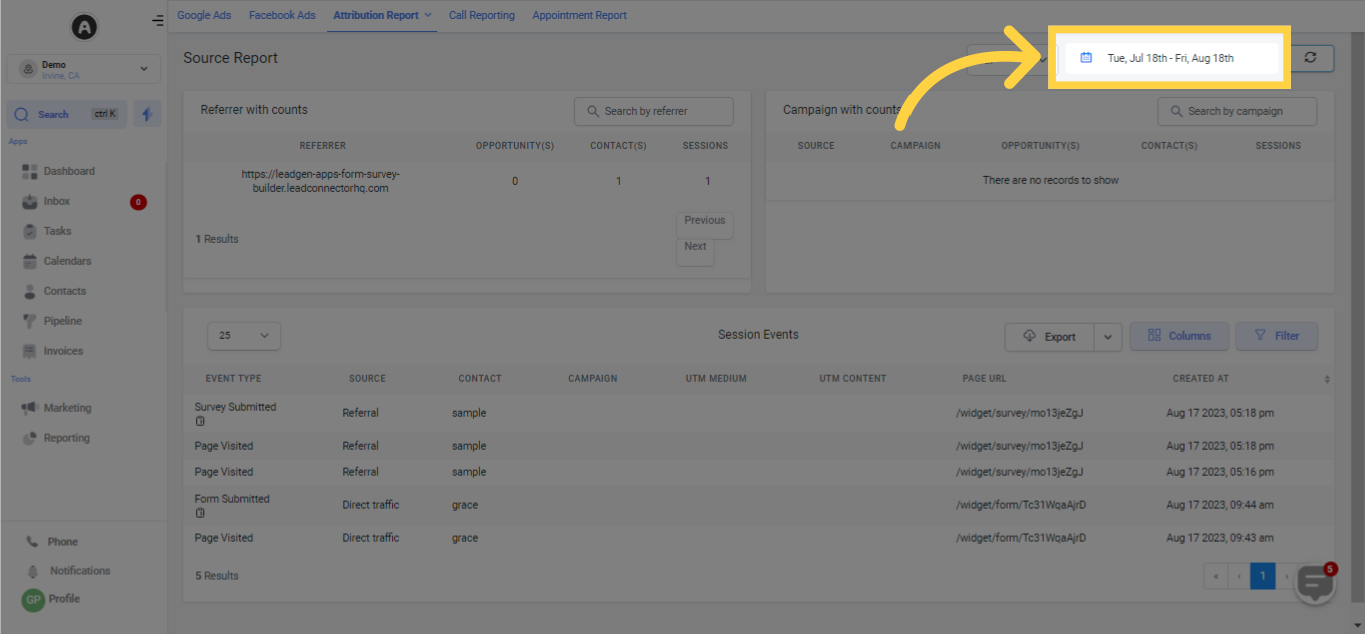
In order to conduct a precise and impactful analysis of attribution data, it's essential to implement filters and establish particular date ranges for your assessment.
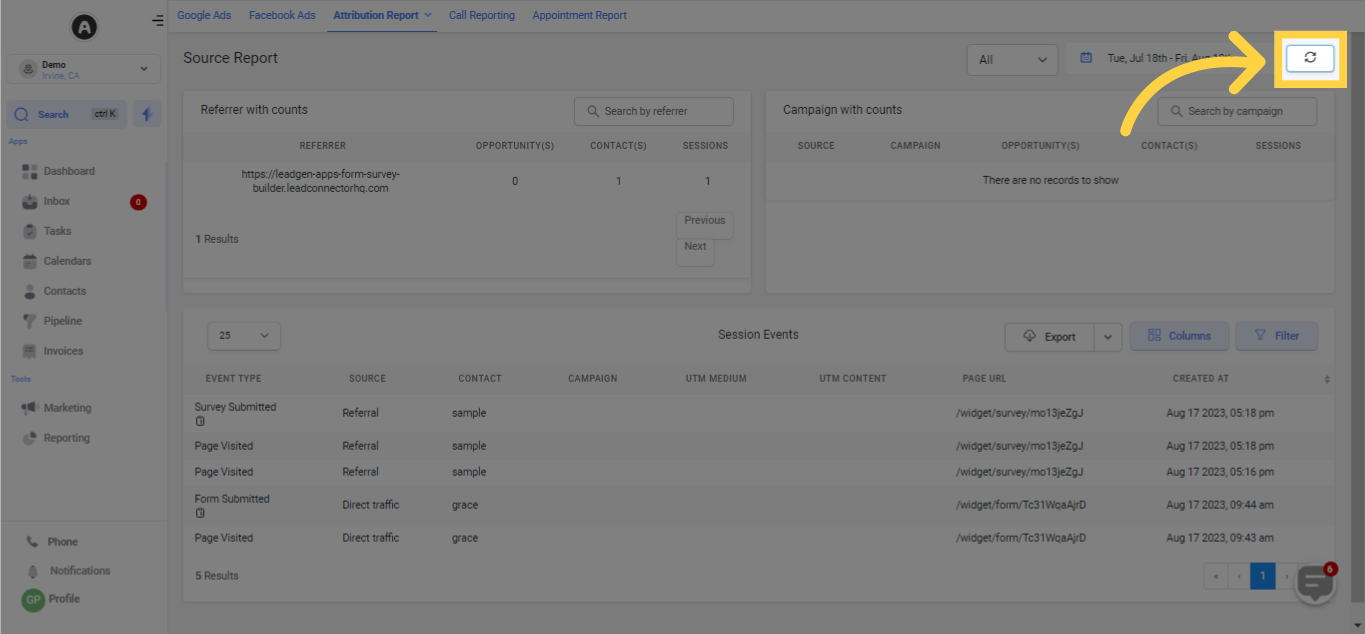
Upon clicking the refresh button, you have the capability to conveniently update all the visible data below, thus removing the necessity to refresh the complete browser tab or window to obtain up-to-date reporting information.
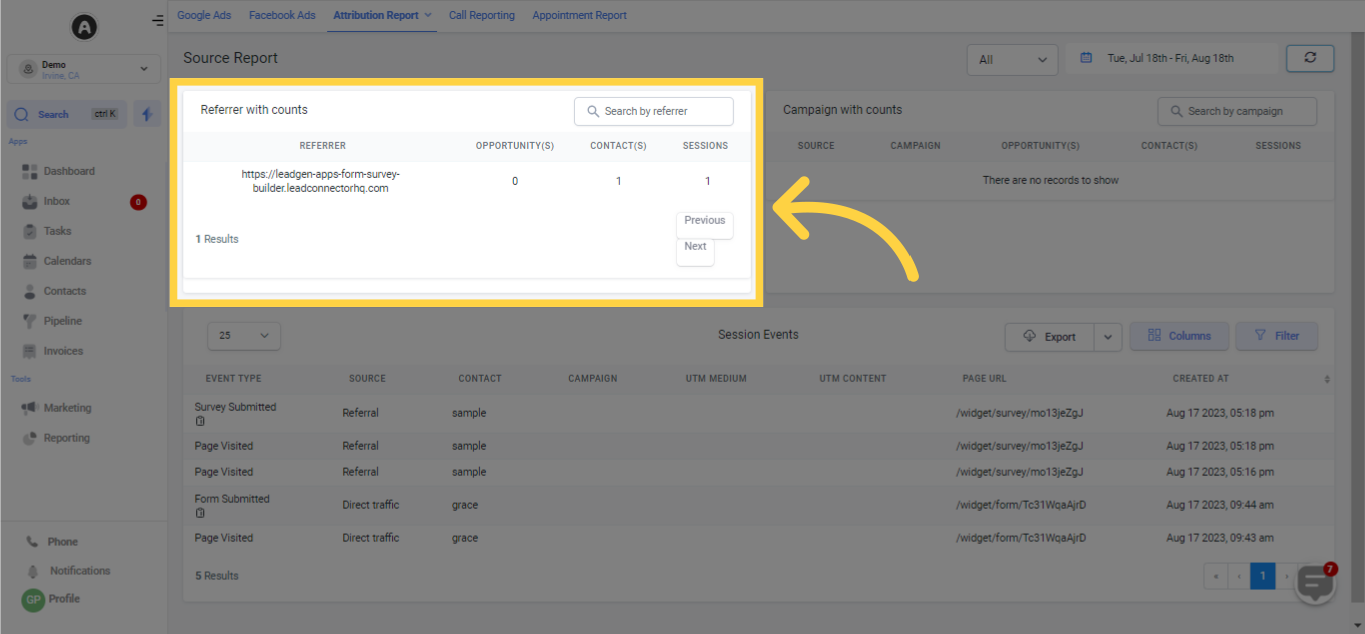
The Referral Report delivers an extensive examination of your referral data, illustrating the sources that played a significant role in obtaining contacts, producing opportunities, and instigating sessions.
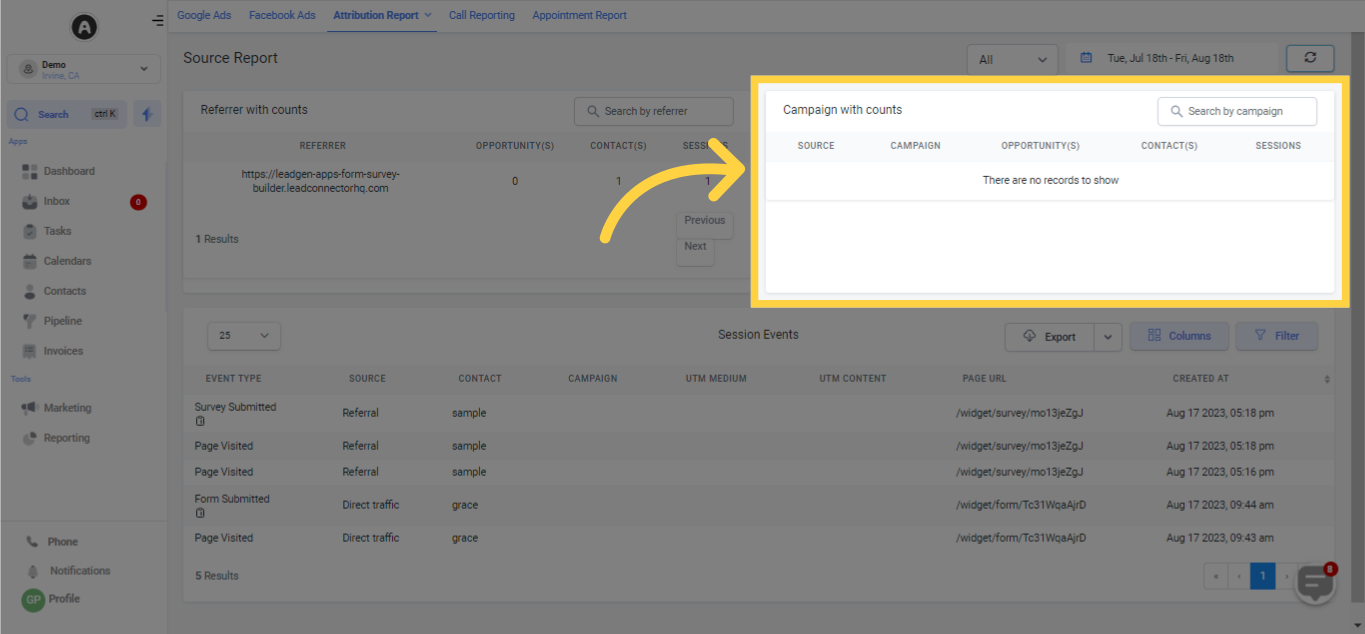
The Campaign Report presents an intricate analysis of your campaign information, underscoring the sources and distinct campaigns that resulted in the procurement of contacts, the creation of opportunities, and the enhancement of user sessions.
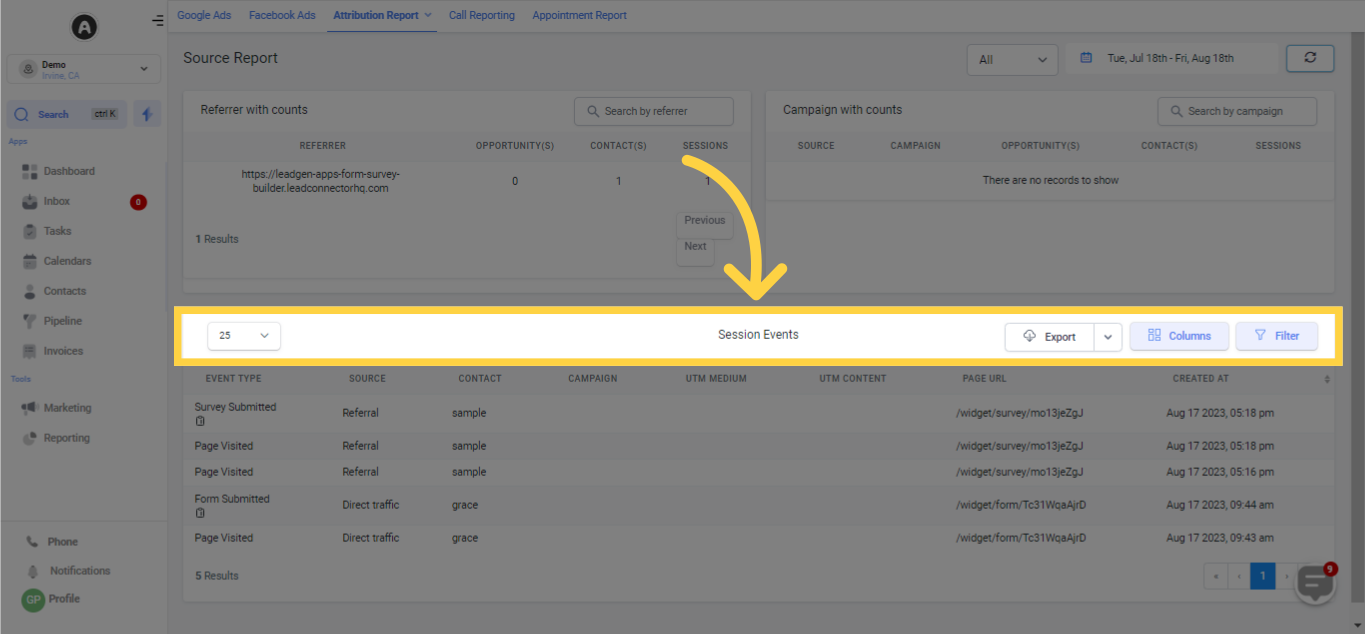
This includes the event type, which denotes specific actions or engagements that transpired within the session; the source, which marks the inception or platform via which the user navigated your website or application; along with contact details about the individual user involved in the session.
This report also illuminates the marketing campaign in correlation with the user's session, coupled with UTM parameters deployed for monitoring your marketing initiatives' efficiency.
Moreover, it underscores the specific webpage where the session originated, along with the precise date and time of its inception.
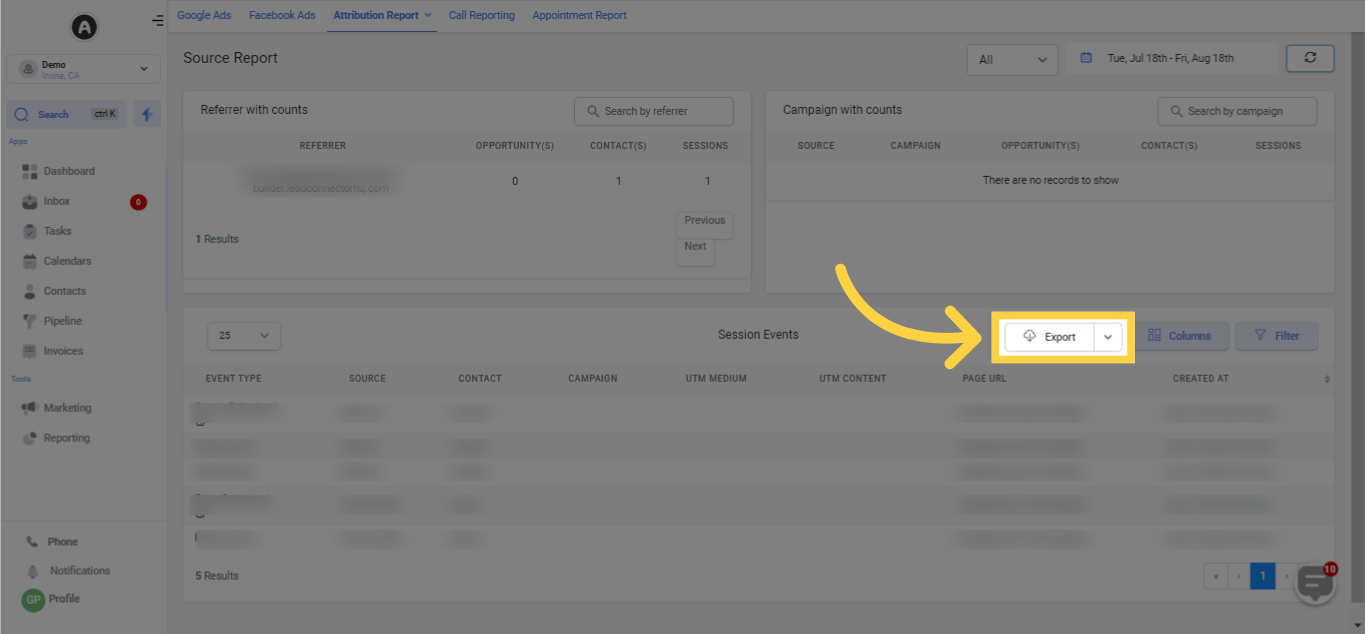
Should you need the data in an Excel spreadsheet format for more detailed analysis or for sharing with team members, you can easily achieve this by clicking on the given export button.
When you click on the columns button, you gain the ability to alter data columns and customize the table to suit your individual needs. This function lets you add or subtract columns, guaranteeing that the displayed information is pertinent and valuable for your unique requirements and analysis.
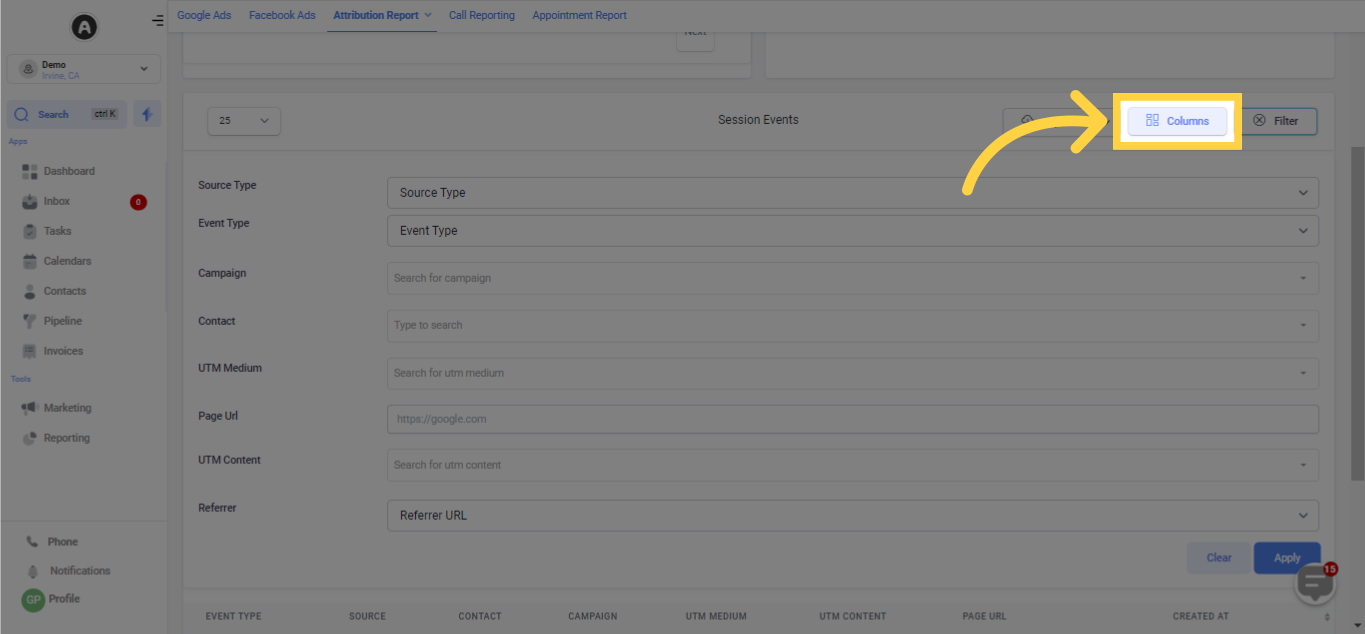
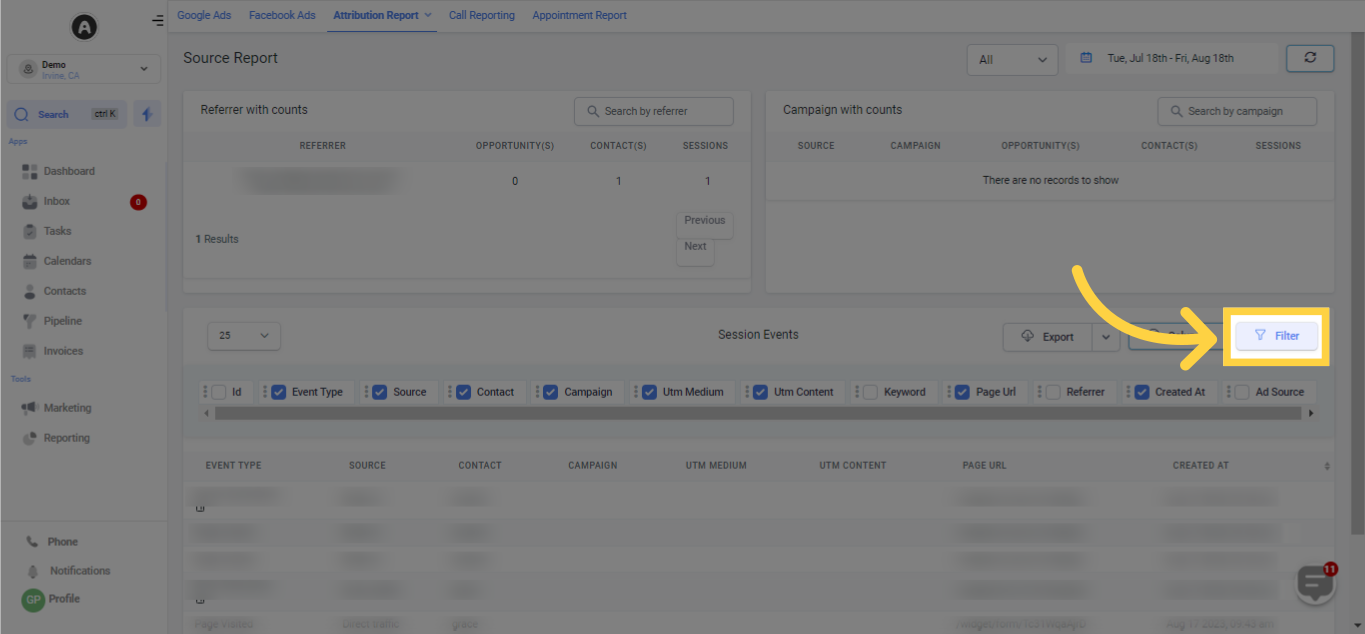
Should you need a more customized perspective of the table data, the filter button grants you the capability to delineate and adjust the data exhibited in the table according to your particular requirements.